
Dr. Fabio Sasahara
Freeway facilities analysis in HCS requires a large number of inputs, including segment geometry, demand, traffic composition, and operational characteristics across multiple analysis periods. When evaluating multiple scenarios, manually entering this data through the graphical interface can become time consuming and repetitive, especially for longer facilities.
The CSV import/export feature in the HCS Freeways module was developed to address this issue. By allowing users to edit facility inputs outside the software and re import them efficiently, the feature significantly streamlines the data input process and supports quick scenario evaluation.
What type of data does the CSV contain?
The exported CSV file contains virtually every parameter used in the analysis of a Freeway Facility, to name a few:
- Segment names, types, and lengths
- Geometric factors such as grade, number of lanes, acceleration/deceleration lanes, lane width, lateral clearance, total ramp density, and more;
- Demand volumes, peak hour factor, capacity/speed/demand adjustment factors;
- Free-flow speeds;
- Managed lane and work zone inputs
For a full list of fields available in the CSV, refer to the Freeway User Guide in HCS.
Step 1 – Define the time-space scope of analysis in HCS
A facility must first be defined in HCS with the appropriate Number of segments, Number of analysis periods, and Segment types. This step ensures that the CSV structure is correctly created with the right number of columns (as function of the number of segments) and rows (as function of the number of analysis periods).
As an illustrative example, a facility with 7 segments and 4 analysis periods (1-hour study period) is created in HCS:
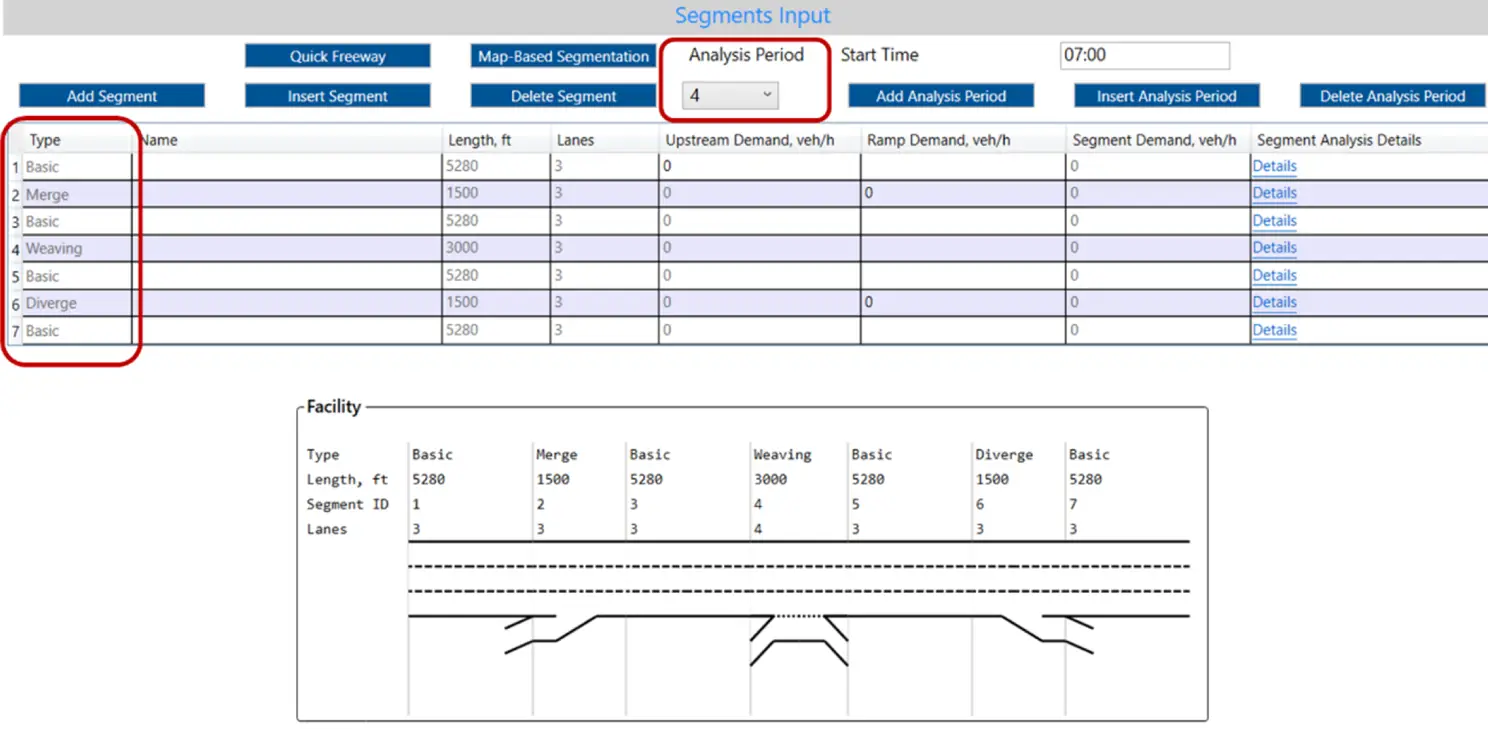
Additional inputs may also be entered through HCS at this step, at the user’s discretion.
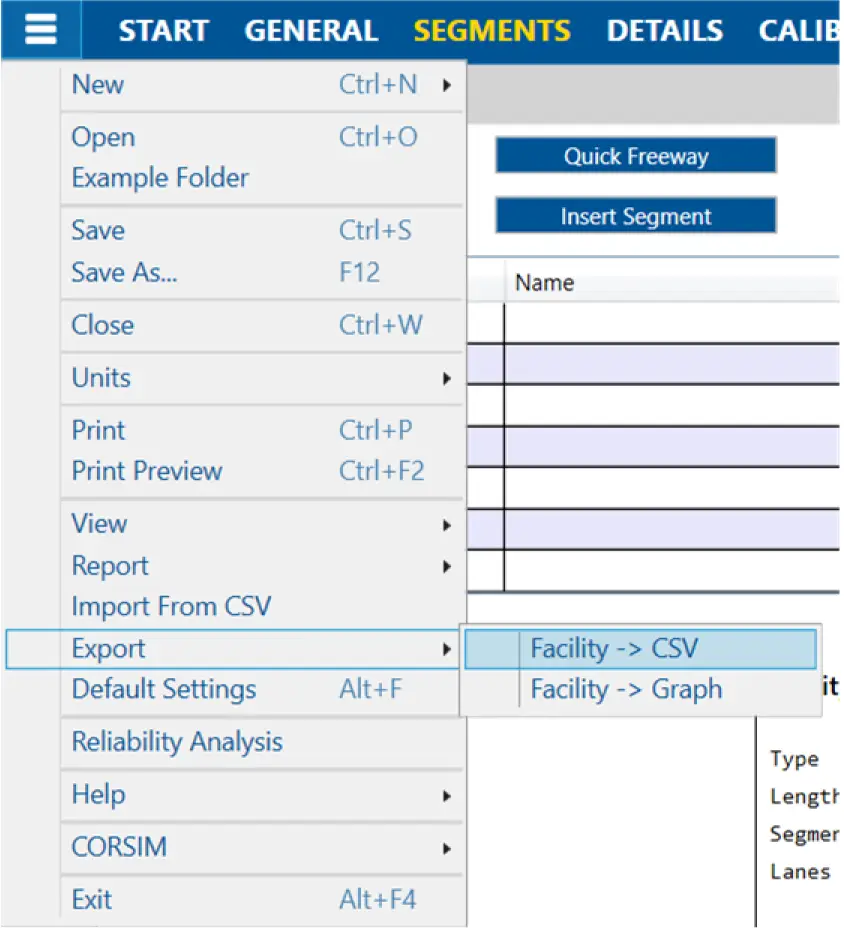
Step 2 – Export to CSV
Once the model framework is defined, a CSV can be created by selecting Export → Facility → CSV:
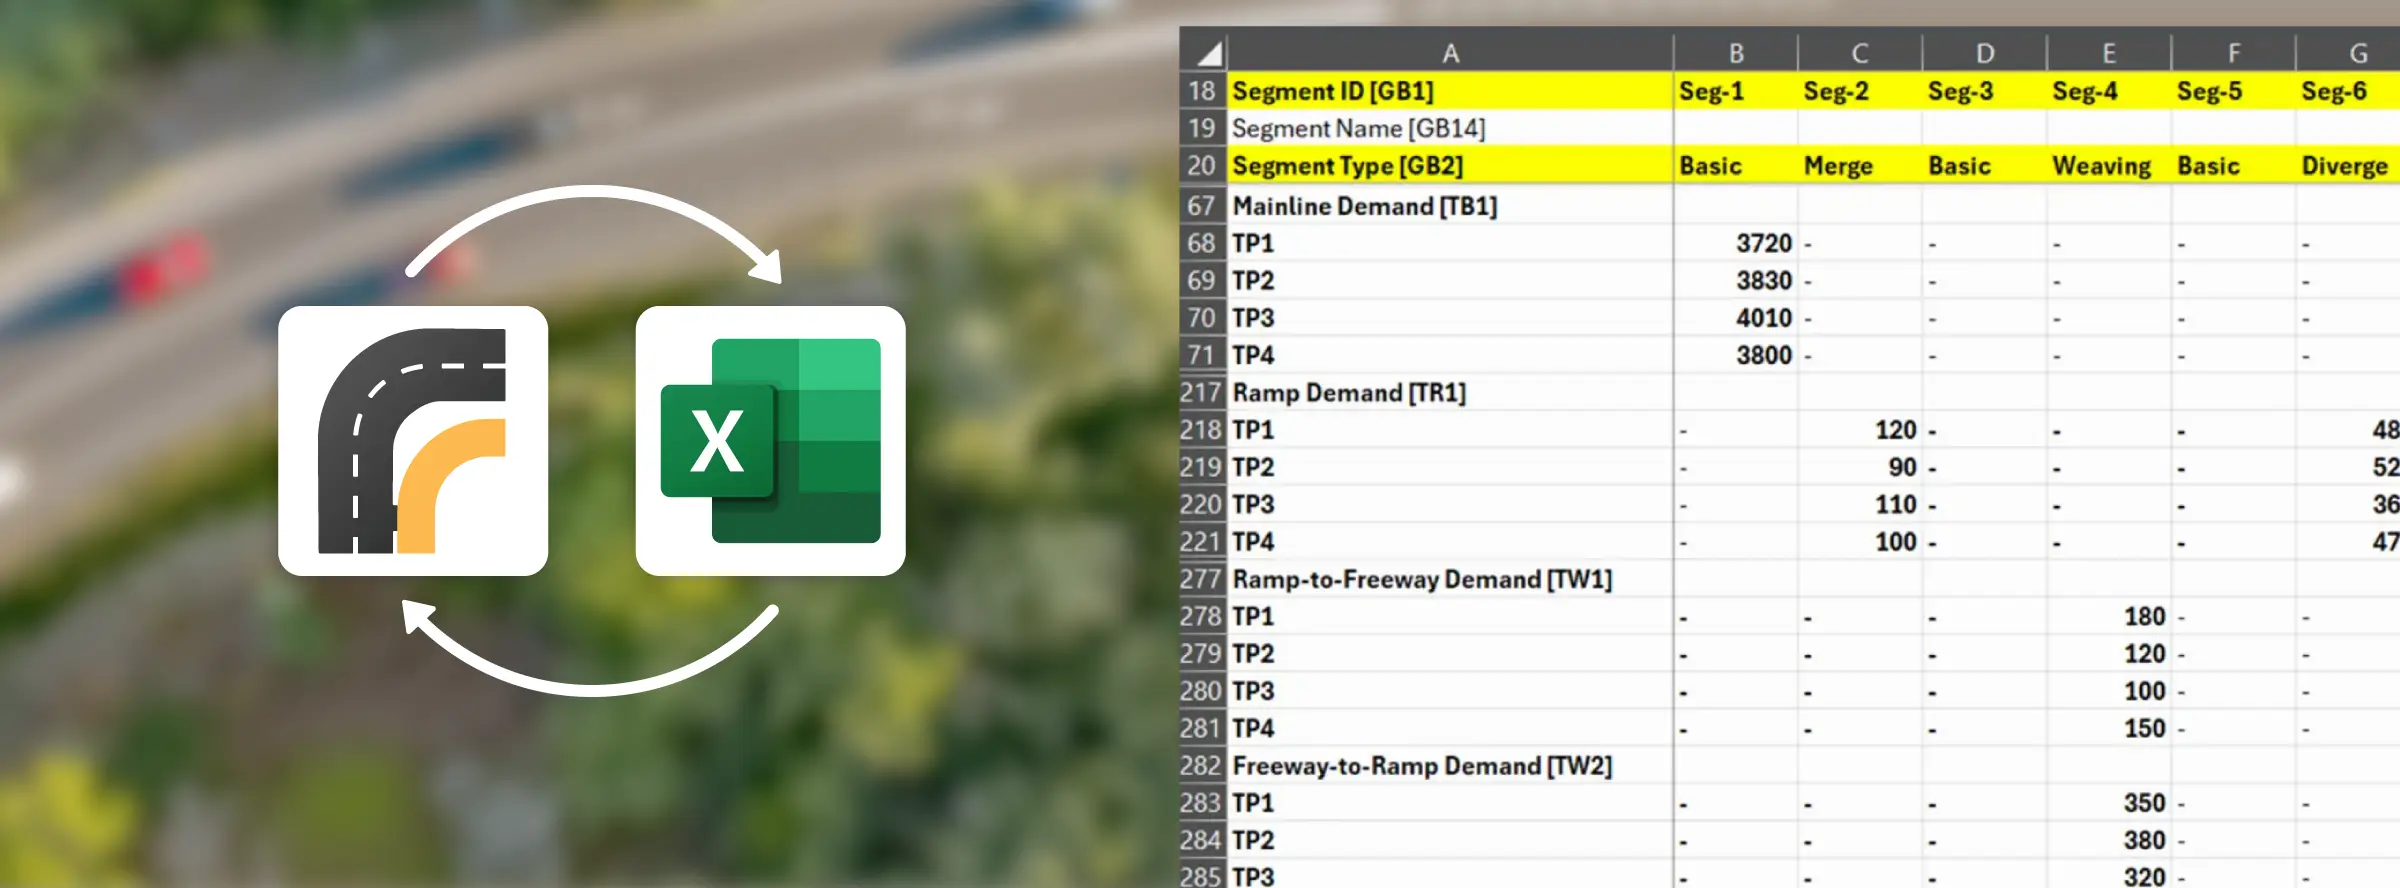
The structure of exported CSV is specific to the file defined in HCS, as function of the number of segments and analysis periods:
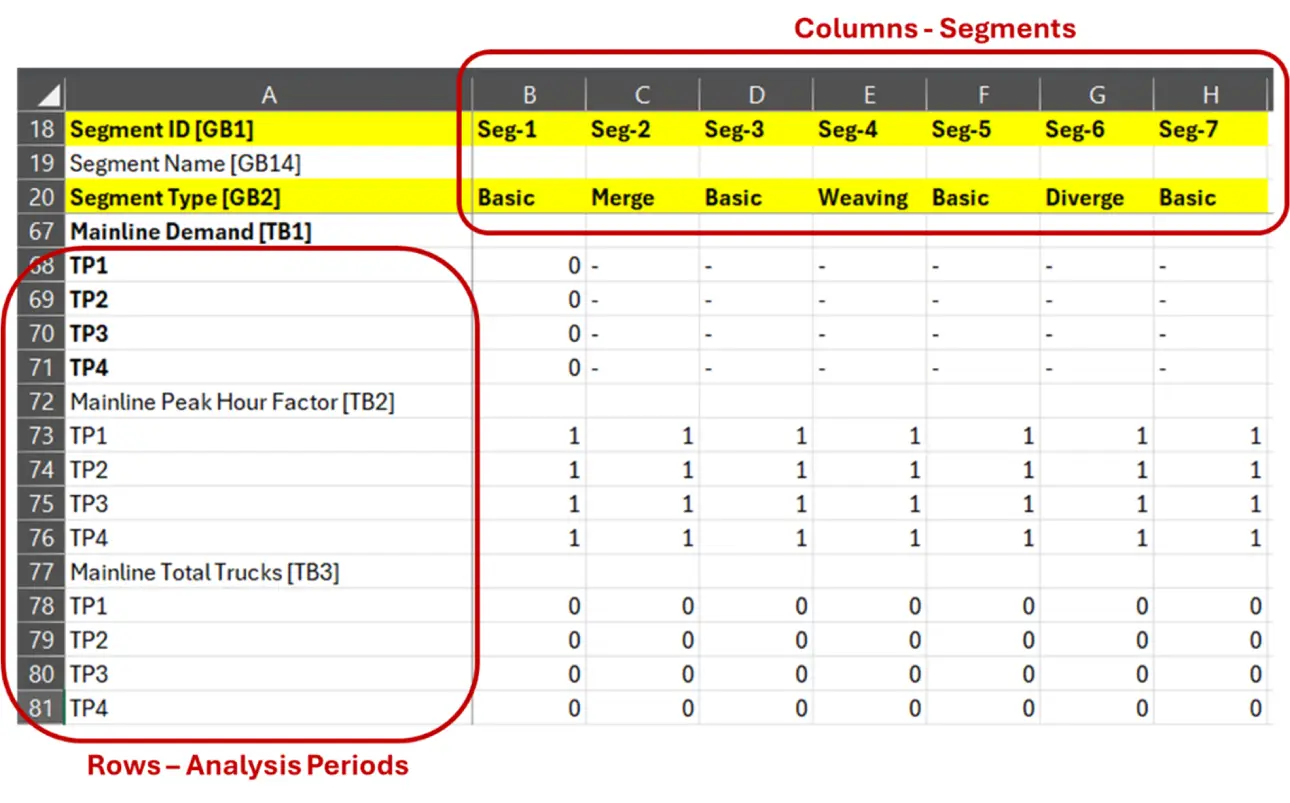
Step 3 – Change inputs in the CSV file
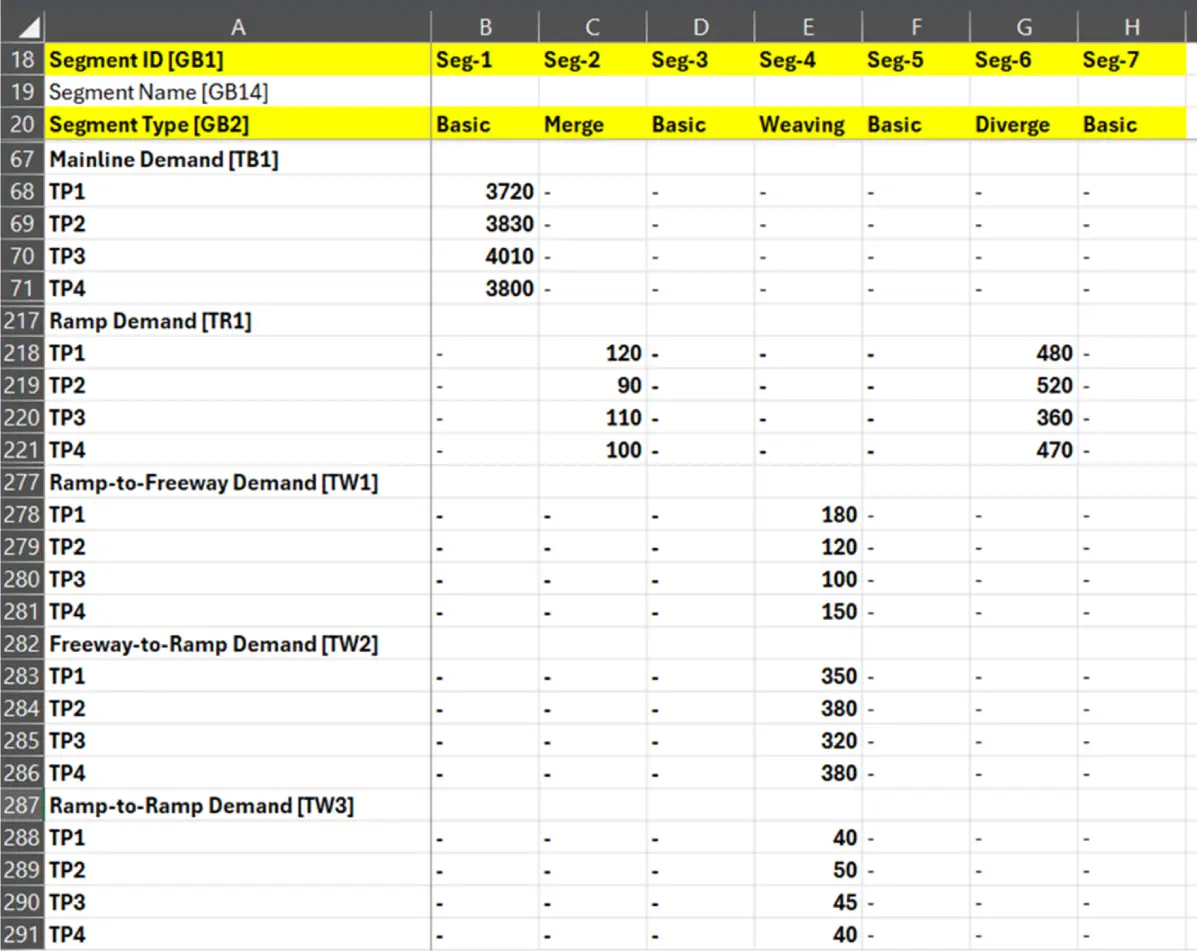
The CSV file can be used to import a large number of parameters. A common use of this feature is the bulk entry of demand volumes for different scenarios – in this sample example, demand volumes will be entered through the following fields:
- Mainline demand [TB1]
- Ramp Demand [TR1]
- Ramp-to-Freeway Demand [TW1]
- Freeway-to-Ramp Demand [TW2]
- Ramp-to-Ramp Demand [TW3]
Each row in the CSV file corresponds to a specific input identified by a bracketed label (e.g., [TB1] for mainline demand). This labeling system allows HCS to correctly map values to segments and analysis periods during import.
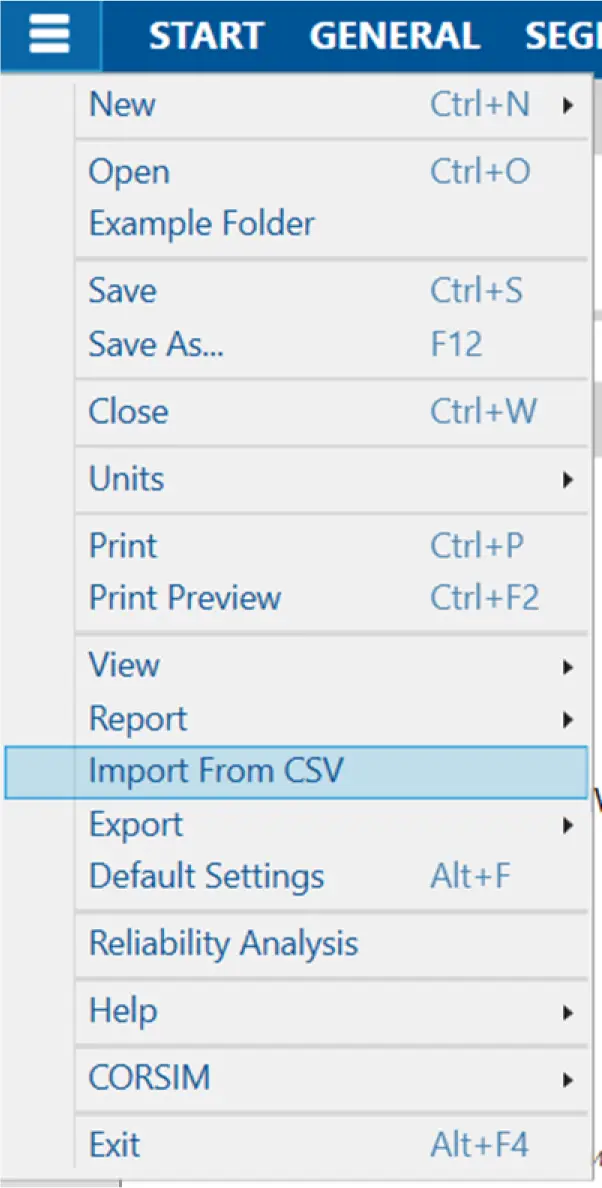
Step 4 – Import CSV back to HCS
After the CSV is saved and ready to be imported, return to HCS and import it back by selecting Import from CSV:
After the process is completed, the HCS model should show all new volumes entered in the CSV file.
Why CSV Import Improves Productivity
Editing inputs in a spreadsheet environment enables:
- Bulk edits across segments or periods
- Formula-based adjustments (e.g., future scenarios with applied growth factors)
- Rapid duplication of scenarios
- Easier quality control and consistency checks
Instead of navigating multiple input pages in HCS, users can make systematic changes in seconds and immediately re-run the analysis. The result is a substantial reduction in time spent on manual data entry and a corresponding increase in the number of scenarios that can be evaluated.
Bonus Feature: Export Outputs into CSV
The Freeways module in HCS also allows exporting analysis outputs into a CSV file, so the user can create customized reports and graphs. The following outputs are provided at the end of the CSV file:
- Flow rates
- Speed
- Density
- LOS
- Segment and Ramp D/c and v/c
- Facility measures: Space Mean Speed, Average Travel Time, Average Density
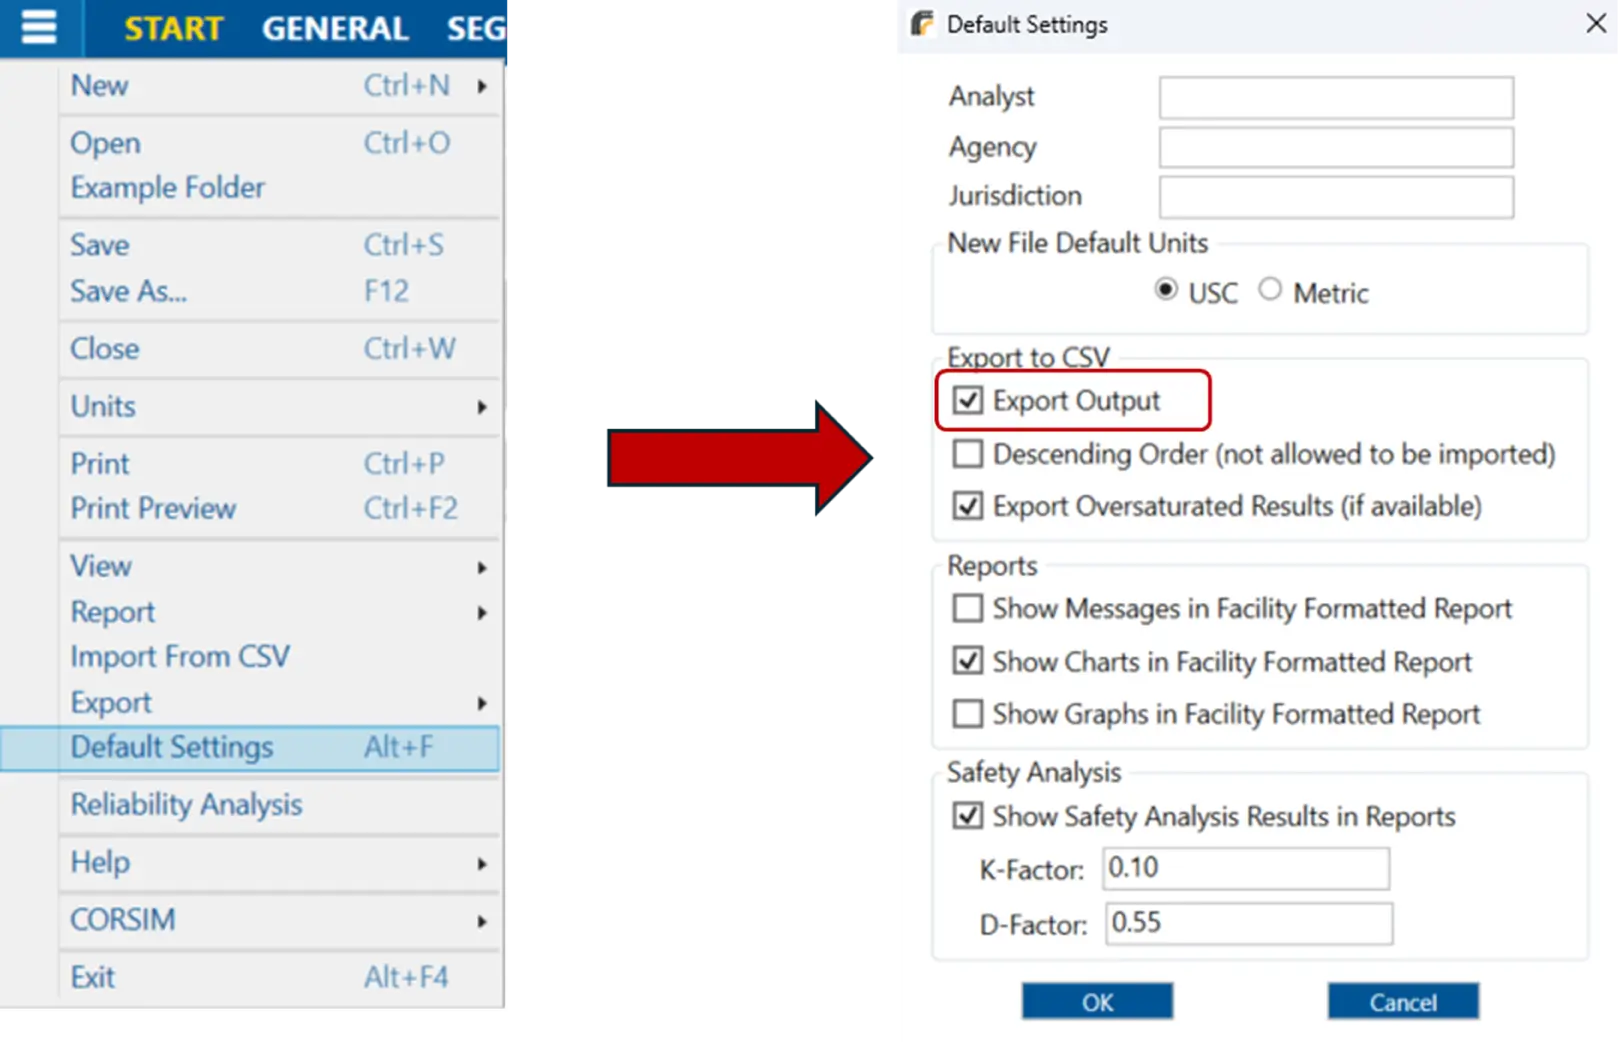
If outputs are not being shown in the exported CSV, make sure to enable the “Export Output” checkbox under Default Settings: