Public agencies invest much to mitigate bottlenecks, which are frequent sources of congestion in freeways. However, an important question follows: will treating a bottleneck actually reduce congestion? To answer this question, it is crucial to understand the concepts of “Active bottleneck” and “Hidden bottleneck” and how to identify them properly.
An active bottleneck has a demand greater than capacity, but the actual volume served in this location is metered by its capacity. Due to this metering effect of active bottlenecks, downstream segments will experience a demand shorter than the real demand. One of these downstream segments might have a capacity smaller than the real demand but still greater than the volume served by the upstream active bottleneck. This is the concept of a “Hidden bottleneck,” which is not easily identifiable by field measurements but can be identified using the Highway Capacity Manual methods.
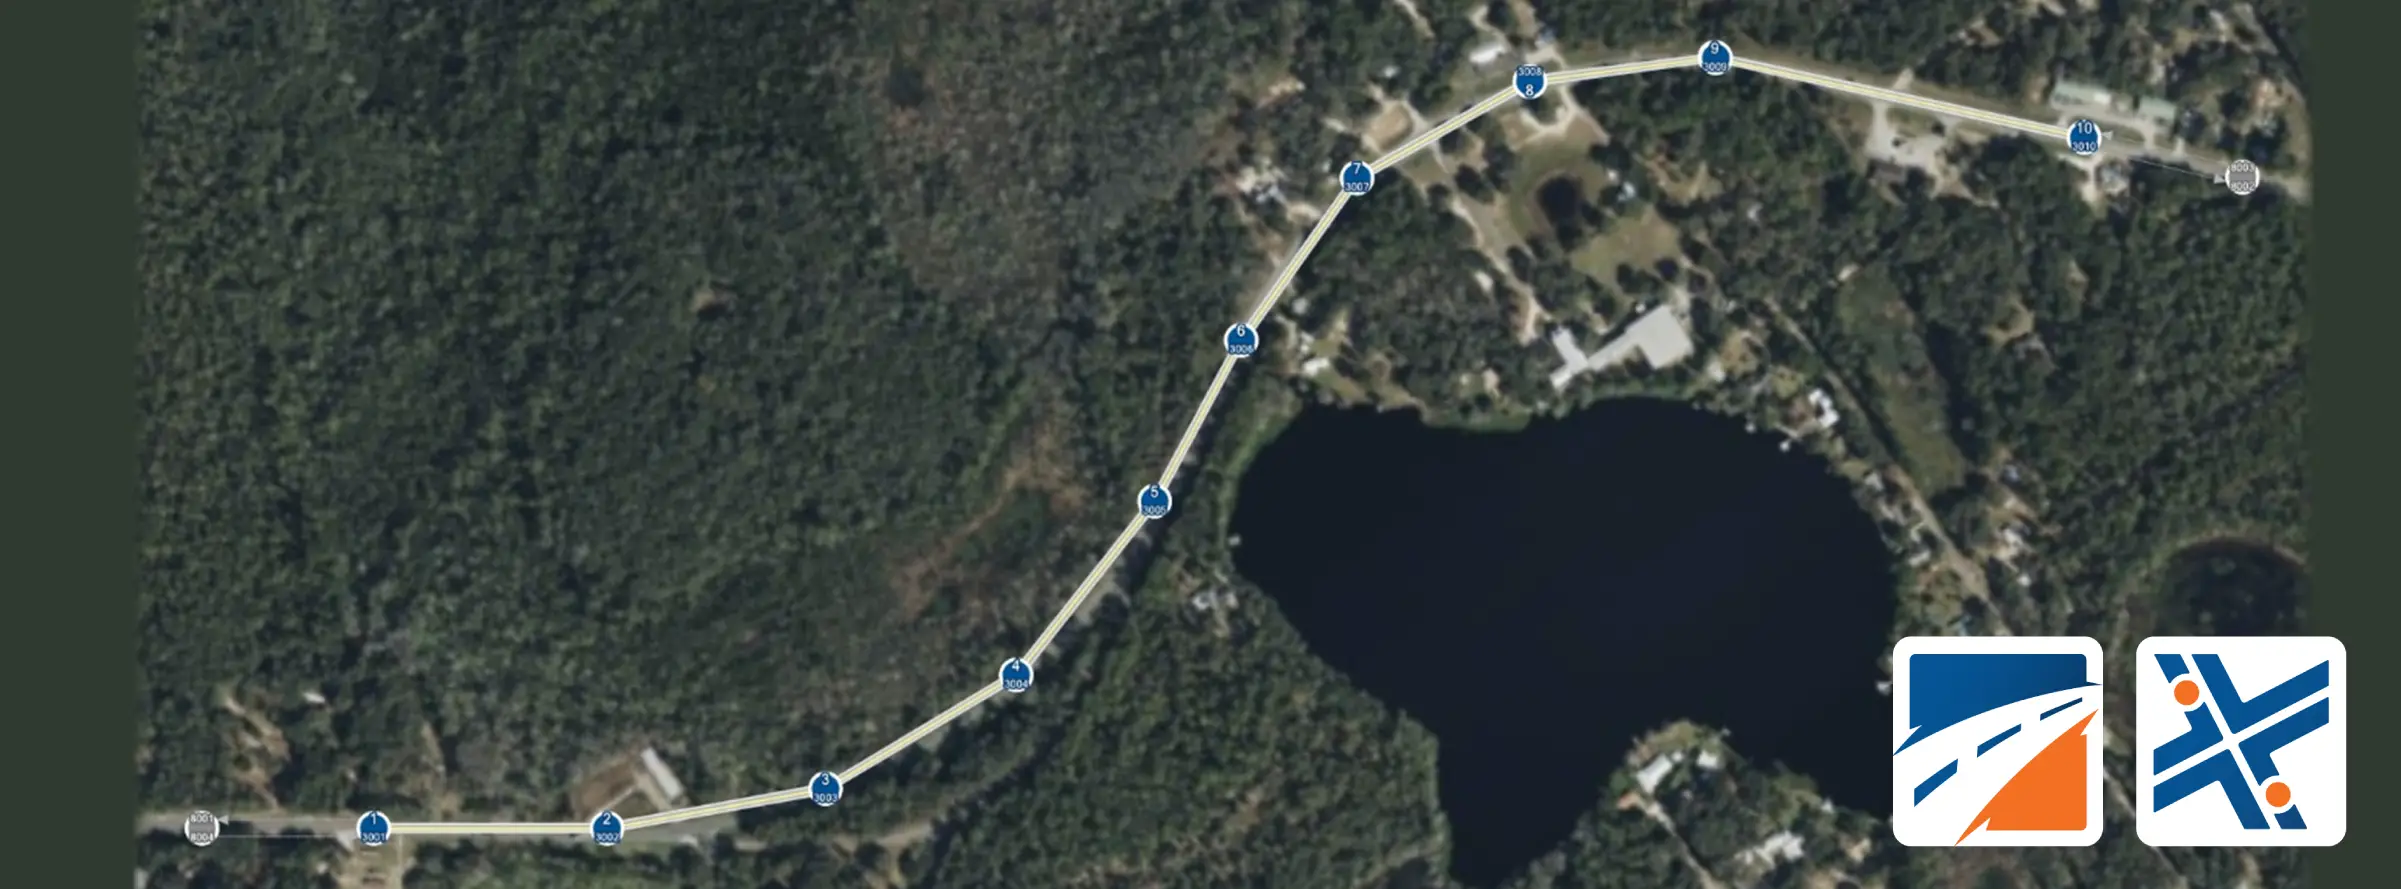
A short example will illustrate how can the Highway Capacity Software (HCS) identify hidden bottlenecks. The first figure shows a short freeway facility with six basic segments and an entering demand of 7,500 pc/h. Since there are no ramps in this facility, the demand for all segments is also equal to 7,500 pc/h. Segments 3 and 5 have a lane drop, making them potential bottleneck candidates. The measured free-flow speed is 55mi/h for segments 1-3 and 70 mi/h for segments 4-6.

Before proceeding, it is important to recall the concept of Queue Discharge Capacity Drop. When a breakdown occurs at a bottleneck, the queue discharge occurs at a rate smaller than the segment’s capacity (a 7% drop, based on a national average). This drop in capacity is a required input when analyzing freeway facilities, as shown on the right:

The results of the capacity analysis of this short facility are summarized in the following table:
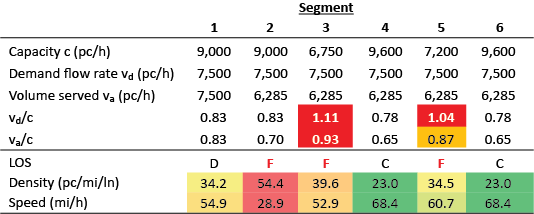
Segment 3 is the first bottleneck met by a traveler in this facility. Although the segment capacity is 6,750 pc/h, this segment serves only 6,285 pc/h. This occurs due to the queue discharge capacity drop of 7%, and can be confirmed by the ratio of volume served and capacity (va/c) of 0.93. Therefore, Segment 3 is an “Active Bottleneck”, causing queues to extend upstream to Segment 2 which also yields LOS F .
Downstream of Segment 3, the arriving flow in subsequent segments is 6,285 pc/h because of the constraining bottleneck. Segment 5 has a capacity of 7,200 pc/h, resulting in a ratio of volume served and capacity va/c = 0.87. Even though the volume served is below capacity, this segment still yields a LOS F because of the true demand (7,500 pc/h) that exceeds capacity (vd/c = 1.04). Also note that the estimated speed in this segment is 60.7 mi/h, higher than Segment 3. Therefore, this segment is a “Hidden Bottleneck”. It does not experience breakdowns due to the upstream active bottleneck, but as soon as the bottleneck in Segment 3 is removed it would become the next active bottleneck in the facility. Therefore, the issue of congestion would not be solved, but would simply move to a new location.
In summary, for truly removing congestion, all active and hidden bottlenecks may need to be addressed. The analytical tools provided in the Highway Capacity Manual and implemented in the Highway Capacity Software are a powerful tool for this purpose.
