A traffic study usually involves a high volume of data inputs and outputs. The quality of a study is only as good as the quality of the data input, which includes being free of typos and accidental input errors.
Over the last releases, our team worked hard to implement tools that facilitated the data input and output process in HCS, such as import/export to .CSV files. This feature can be an invaluable tool to streamline your data input/output process to ensure efficient and error-free traffic modeling.
This article highlights some aspects of the import/export to .CSV, including some potential applications.
Streets to .CSV – How does it work?
In the Streets module, it is possible to export an intersection/corridor to a .CSV file, where the most important parameters can be easily edited in a spreadsheet format. To export a model, select File → Export → Streets CSV File:
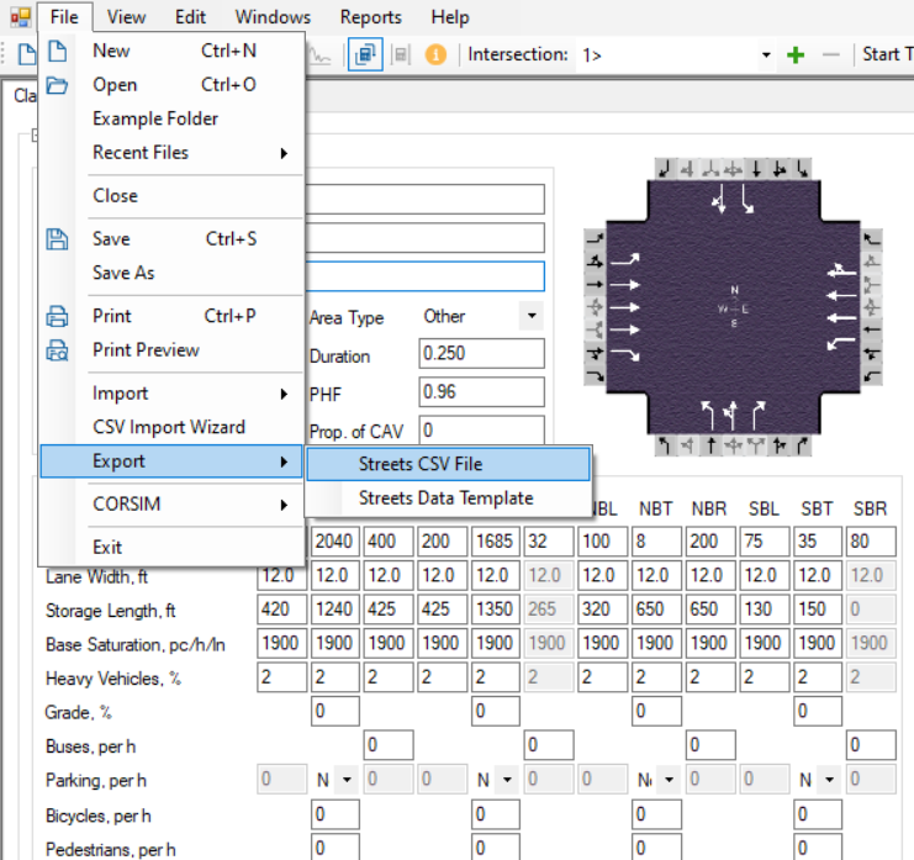
Streets CSV File Export
All intersections and time periods are then exported to a spreadsheet, including the following parameters:
- Intersection geometry: number of lanes, lane width, storage length, grade %;
- Traffic: vehicular demand, heavy vehicles %, bicycles, buses, peak hour factor;
- Signal controller settings: cycle length, control type (pre-timed/actuated/coordinated), offsets, phase splits, red/yellow intervals, minimum green, passage time, and more;
- Performance measures: volume-to-capacity ratio, control delay, LOS, and queue storage ratios.
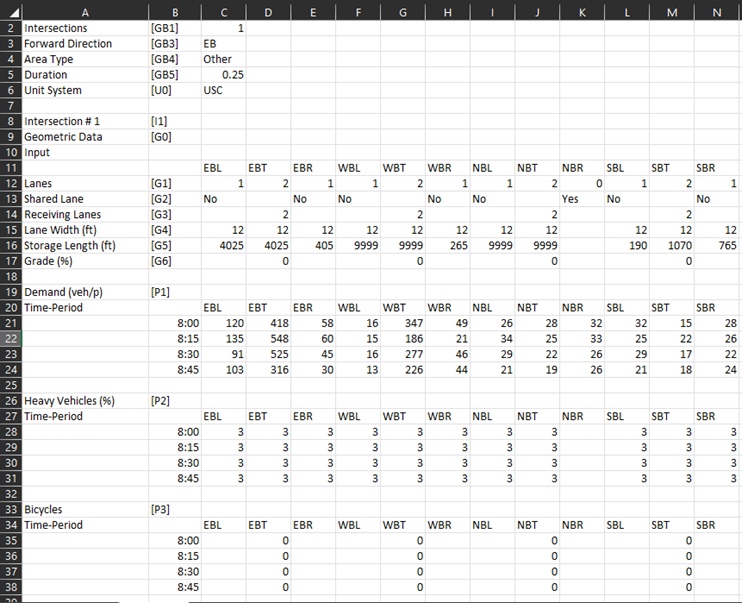
Exported intersections and time periods
After editing the parameters in the spreadsheet, import it back to HCS:
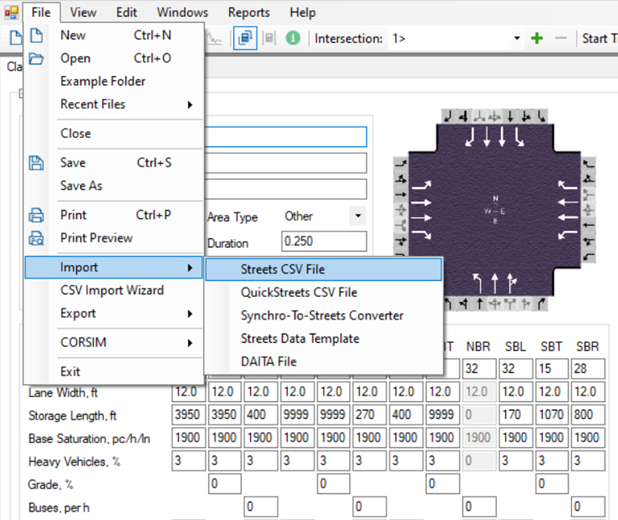
Streets CSV File Import
Evaluating multiple scenarios with different parameters
Traffic studies typically evaluate multiple scenarios comprised of different time horizons and/or different alternatives. With an exported .CSV file, the user can easily create multiple scenarios and import them back to HCS, such as different future years based on a certain traffic growth forecast:
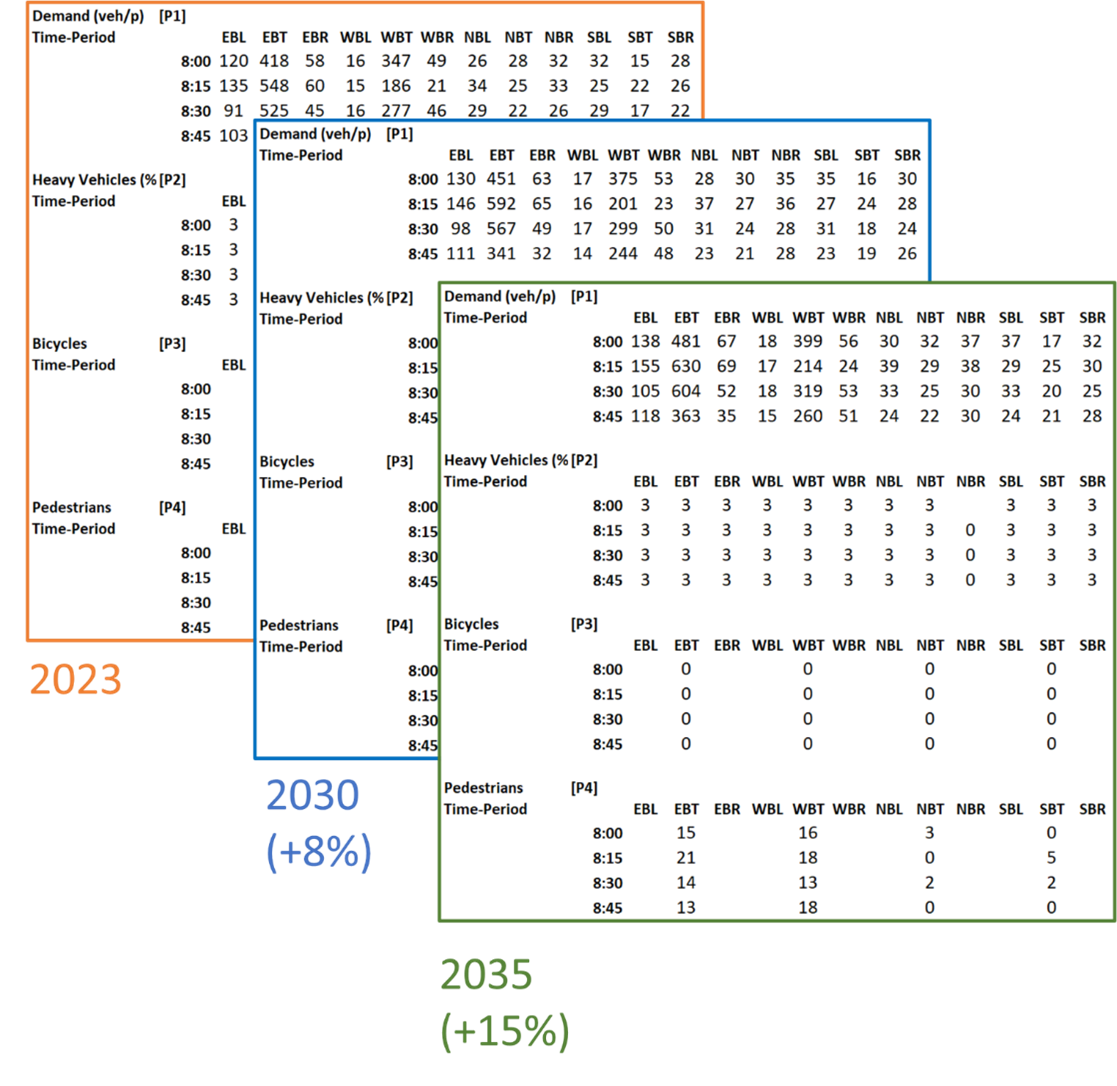
Example of traffic growth forecast for 2023, 2030, and 2035
Comparing different files to evaluate changes
Professionals who review traffic studies frequently need to check multiple files for accuracy. With project parameters listed in a spreadsheet utilizing a standardized structure, the user can easily apply simple Excel formulas to compare values between two different files and check for differences:
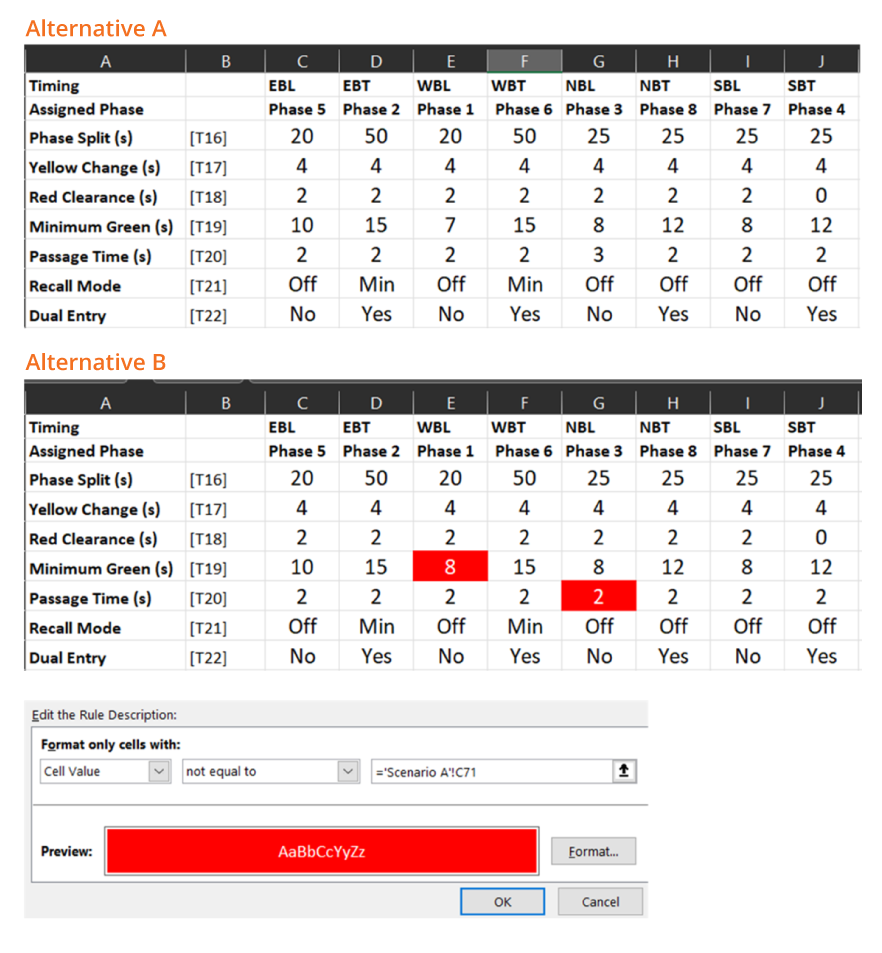
Comparing values and parameters among two different files
Exporting performance measures for external reports
Every organization has its own templates and styles for reporting and presenting studies. By exporting the analysis results to a spreadsheet, users can quickly link the results to produce graphs and dashboards that fit their templates.
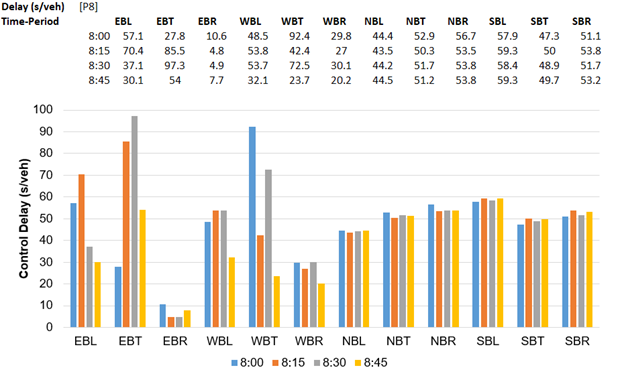
Export performance measures for external reports
Read more about similar features available in the Freeway Facilities module in HCS here.
