
Dr. Fabio Sasahara
The Highway Capacity Software (HCS) offers planning-level tools to streamline high-level analyses of freeway facilities. In these studies, the analyst seeks to quickly identify, without the need of several detailed inputs, which improvement alternatives may be worthy of further detailed analysis.
This article discusses two planning-level tools for Freeway analyses: Service Volumes and Design Analysis. Both can be accessed when performing a single-segment analysis using HCS.
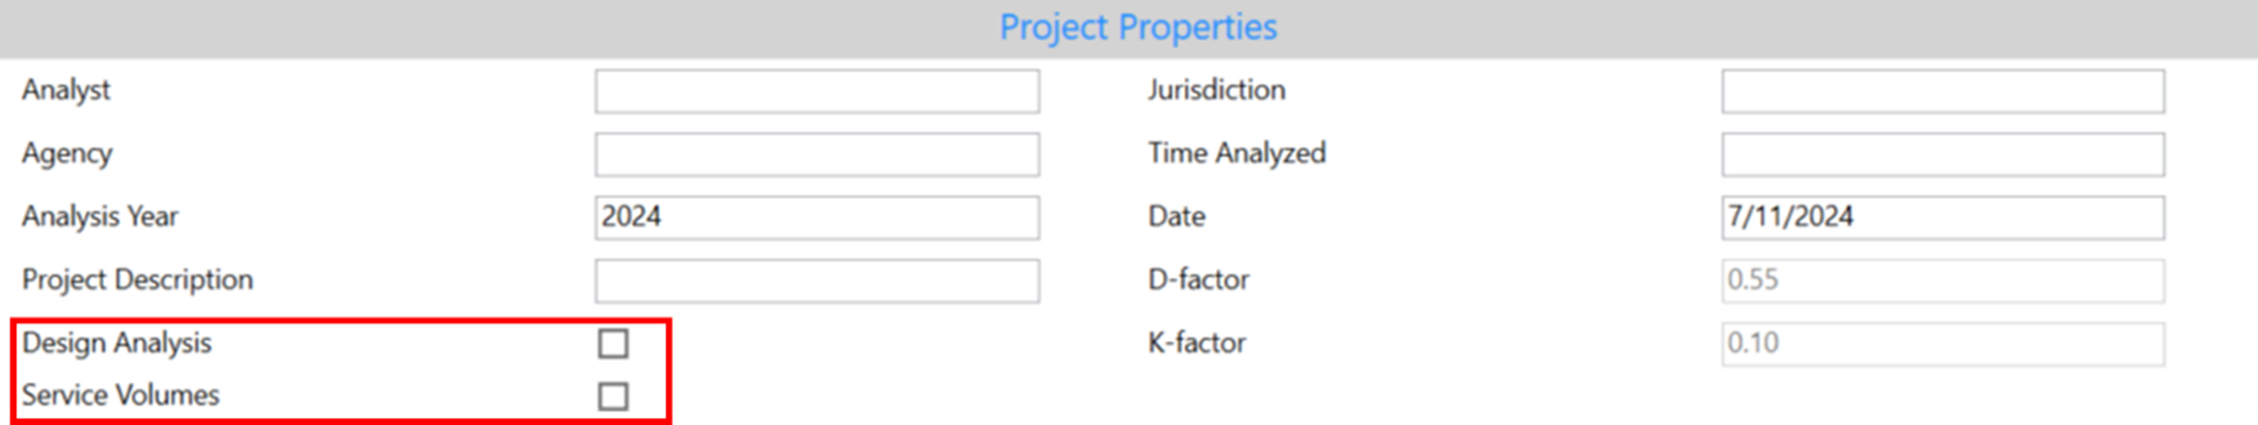
Planning level checkboxes in HCS Freeways
Design Analysis
In design analysis, a known demand volume is used to determine the number of lanes needed to deliver a target LOS. Once the “Design Analysis” checkbox is selected, a new table will be added to the bottom of the formatted report:
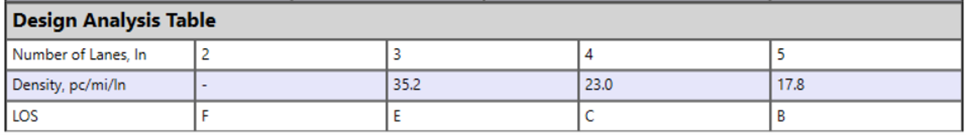
Design Analysis Table Report – HCS
This table can be interpreted as follows: if the subject segment is built with 2 lanes, it will yield a LOS F; if built with 3 lanes, a LOS E will be obtained, and so on.
Service Volumes
Generalized service volume tables are a planning-level tool that quickly shows what volumes (hourly and daily) can be served in the subject segment for a target LOS. Once the “Service Volumes ” checkbox is selected, a new table will be added to the bottom of the formatted report:
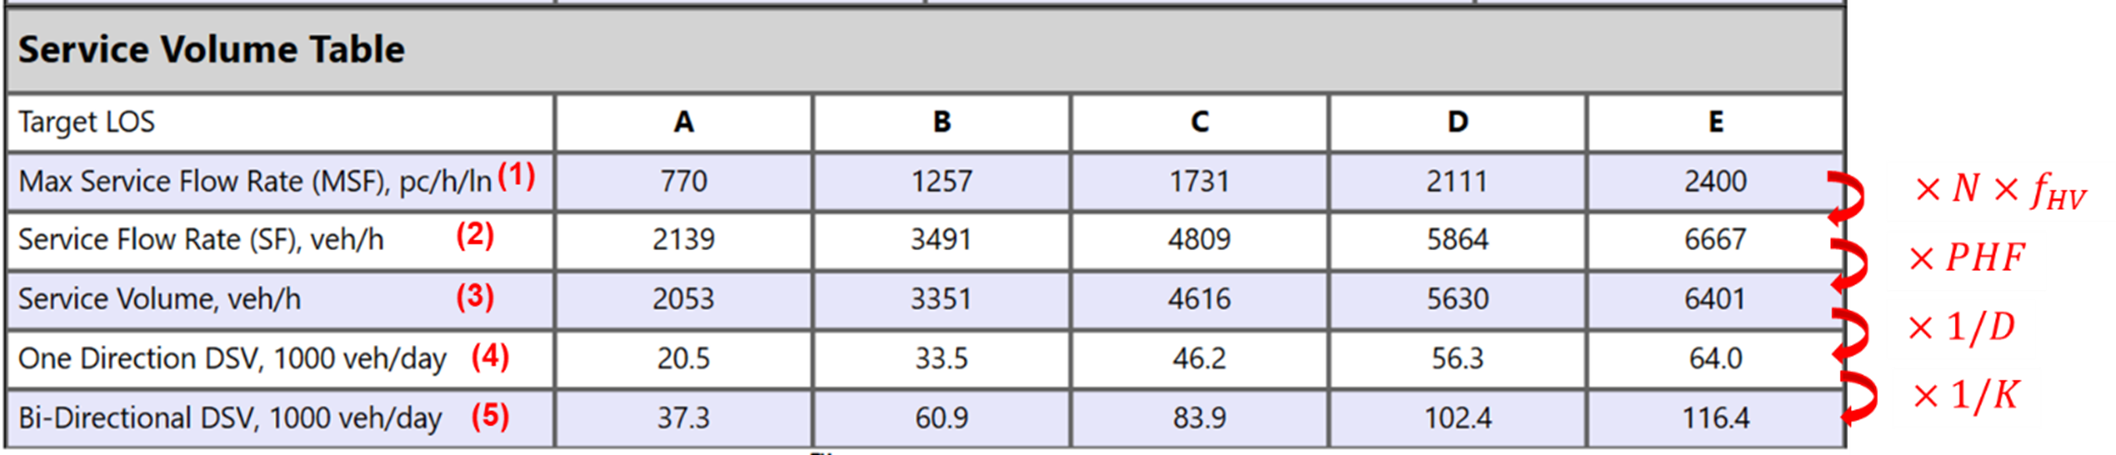
Service Volumes Table Report – HCS
The rows in the table above can be interpreted as follows:
- Maximum 15-min hourly flow rate accommodated for LOS i (pc/h/ln), one direction
- Maximum peak hour flow rate accommodated for LOS i (veh/h), one direction
- Maximum hourly volume accommodated for LOS i (veh/h), one direction
- Maximum daily volume accommodated for LOS i (veh/day), one direction
- Maximum daily volume accommodated for LOS i (veh/day), two directions (AADT)
Note that when the “Service Volumes” checkbox is selected, the input boxes for K and D also become enabled:
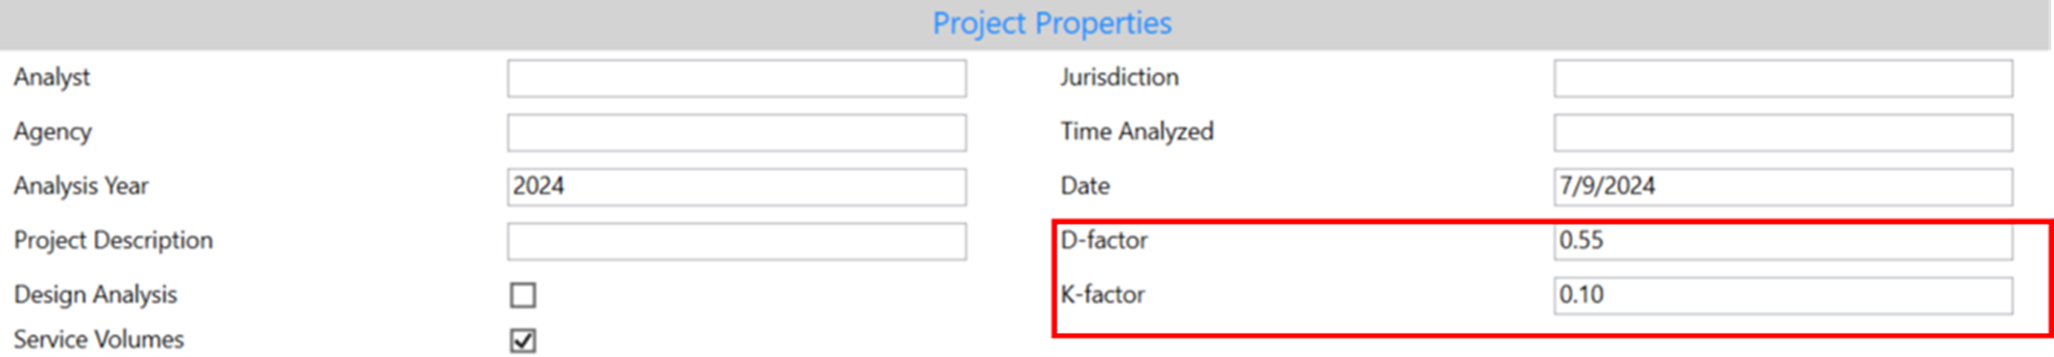
K and D factors as inputs to the Service Volumes analysis