Tips & Hints
Emissions Model for Urban Streets
Emissions Model for Urban Streets
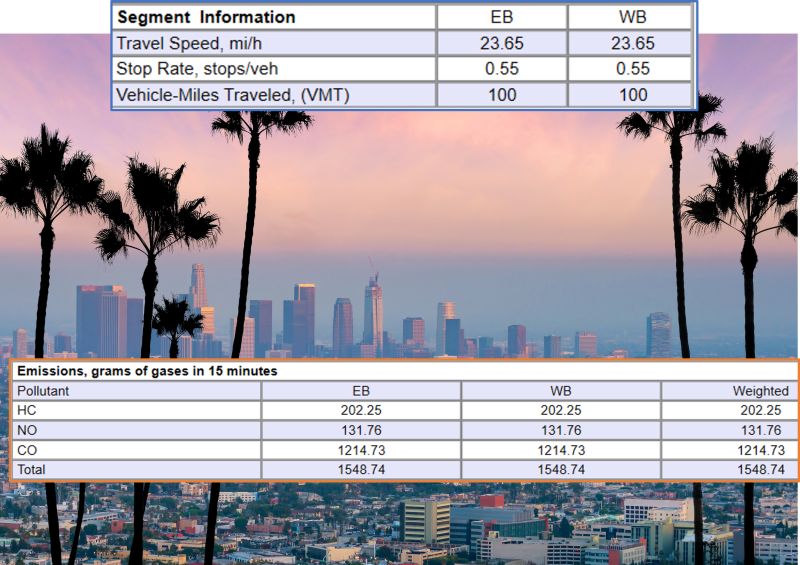
The emissions model was based on NGSIM Data, and pollutant outputs are calculated for urban segments as a function of Vehicle-MilesTravelled and the number of STOPS for vehicles. As a result, environmental measures benefit from both reductions in travel quantity and congestion/delay mitigation measures.
Multilane Highways Merge/Diverge and Weaving Segments
Multilane Highways Merge/Diverge and Weaving Segments
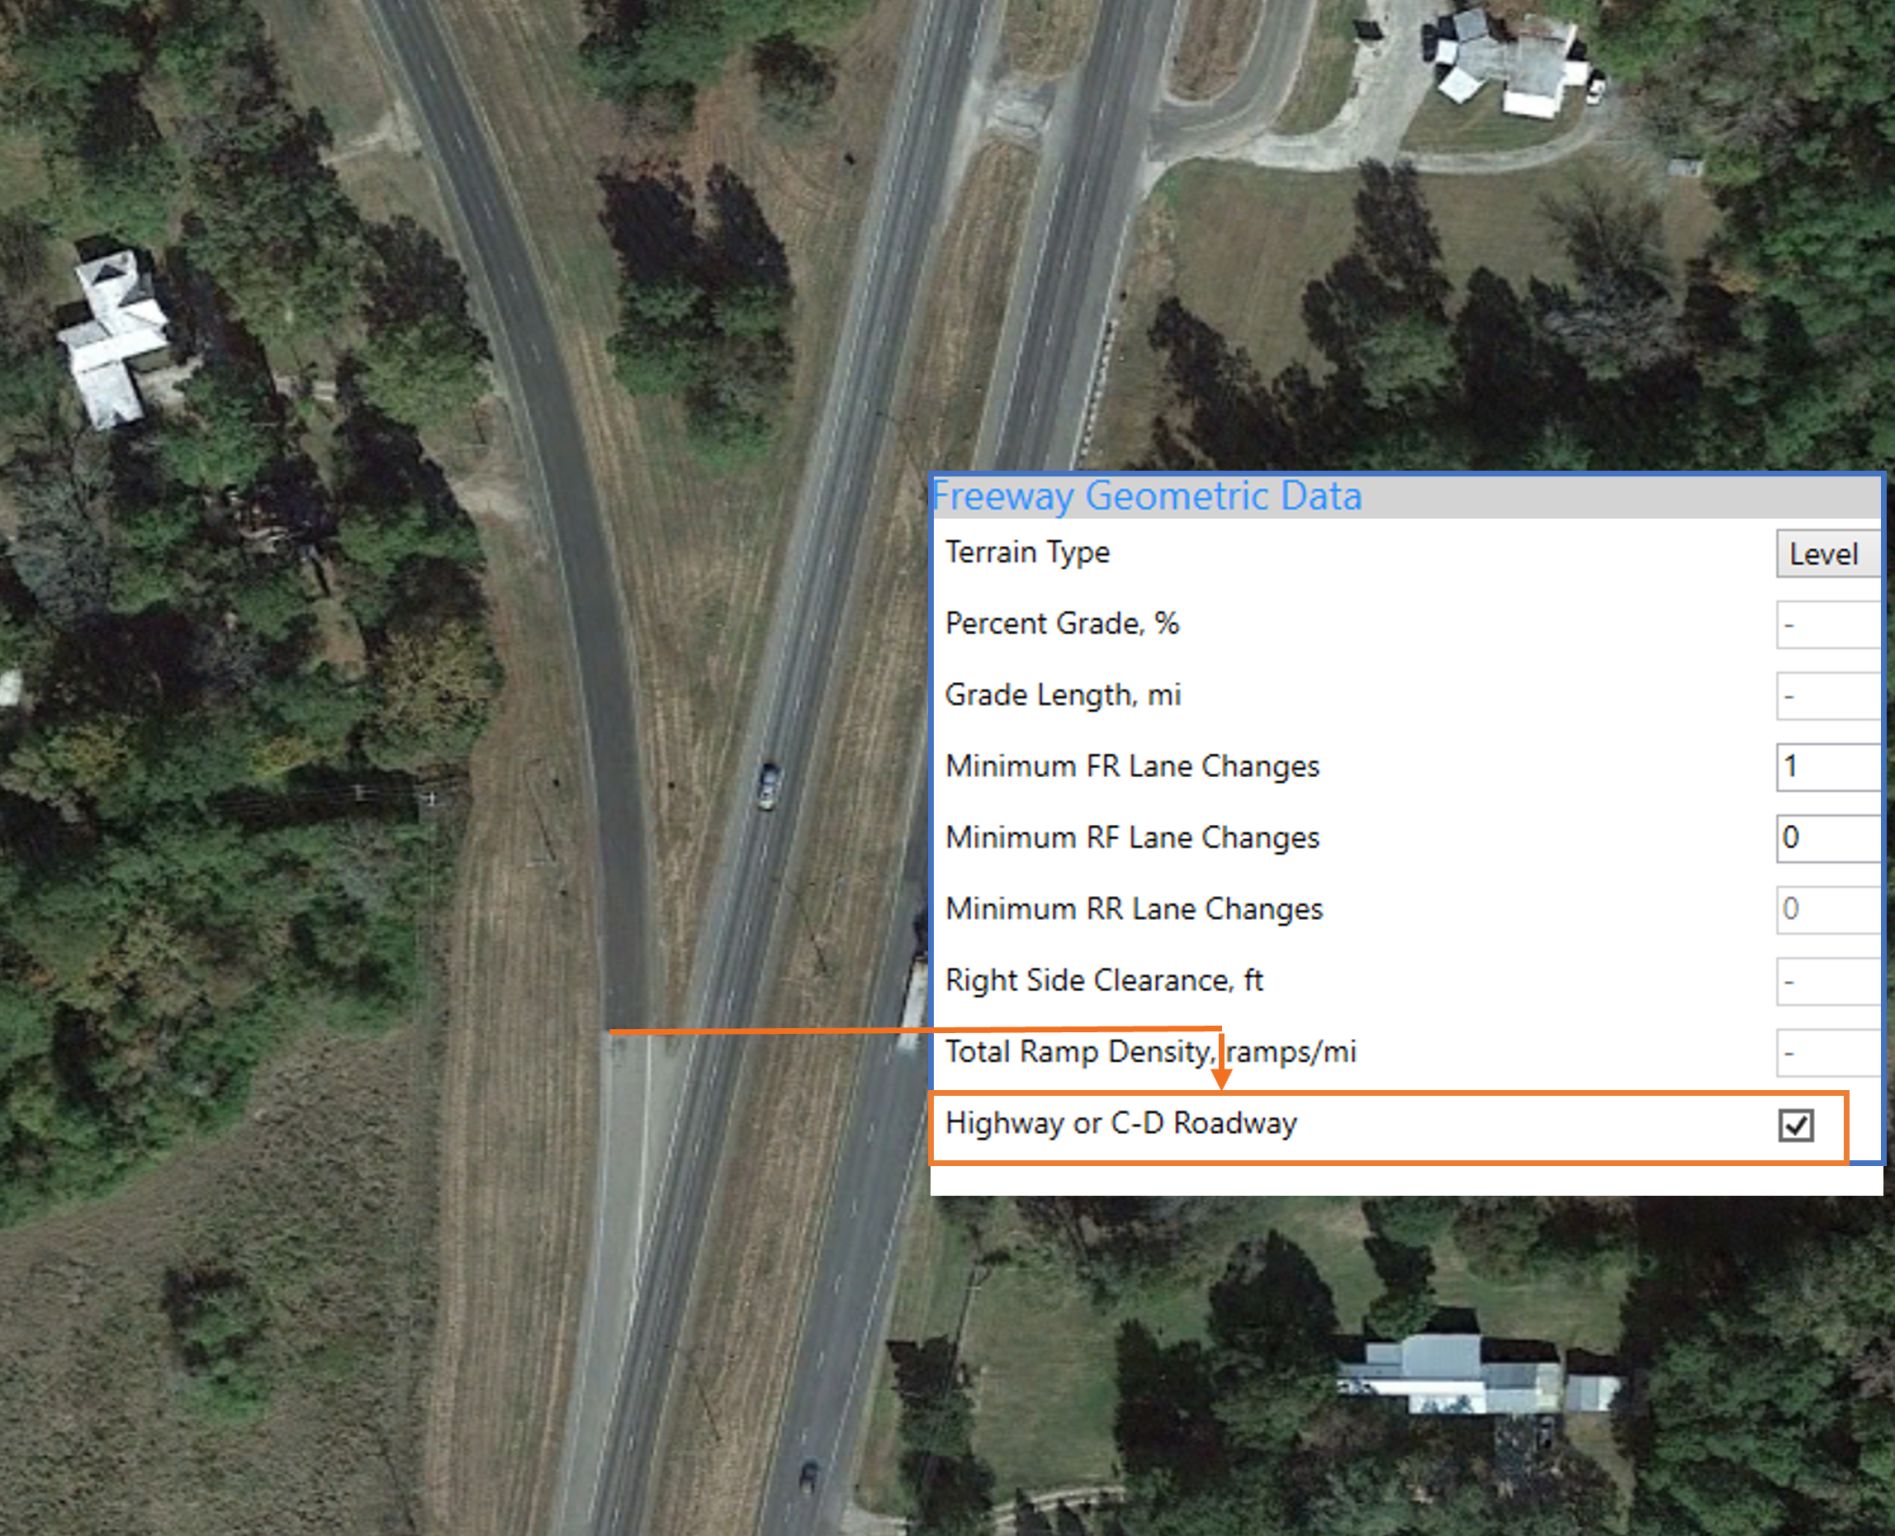
The HCM can analyze isolated merge, diverge, or weaving segments on multilane highways and C-D Roads.
On the HCS Freeways module, for isolated segment analysis, the option “Highway or C-D Roadway” is used to analyze ramps or weaving segments on multilane highways.
Note that other parameters, noticeably the FFS, must match those of multilane highways for the method to work consistently.
Super 2 (2+1) Two-Lane Highways
Super 2 (2+1) Two-Lane Highways
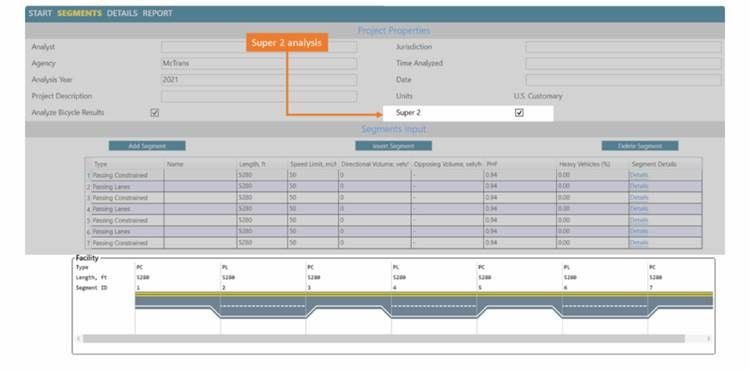
A Super 2 Highway, also called “2+1 Highway”, is a two-lane highway configuration with a continuous three-lane cross-section, with the middle lane being a passing lane that alternates direction.
HCS implements the research project NCHRP 17-65 – Improved Analysis of Two-Lane Highway Capacity and Operational Performance, incorporated in the 7th edition of the HCM, which includes equations to measure the performance of this highway type.
Delays for the Main Street at TWSC Intersections
Delays for the Main Street at Two-Way Stop-Controlled Intersections
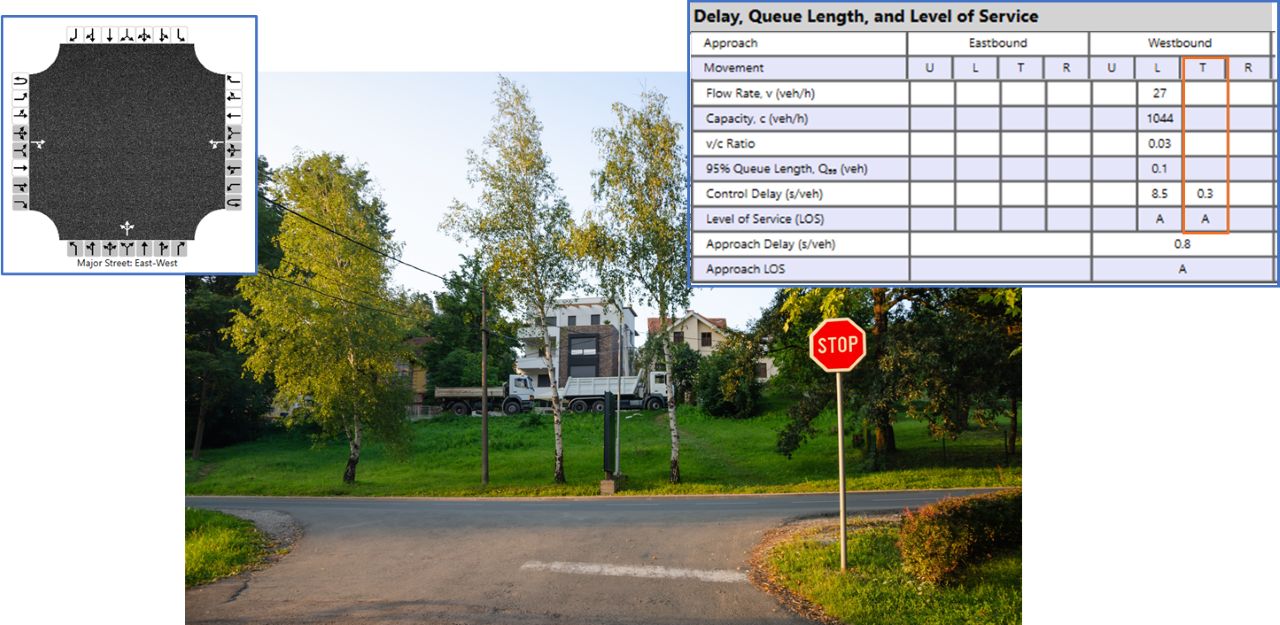
At two-way stop-controlled intersections, Rank 1 movements (main street through and right-turns) are free. When shared lanes are used, the left-turn movements (Rank 2) cause delays that may affect other main street movements.
Modern Roundabout Methodology
Modern Roundabout Methodology
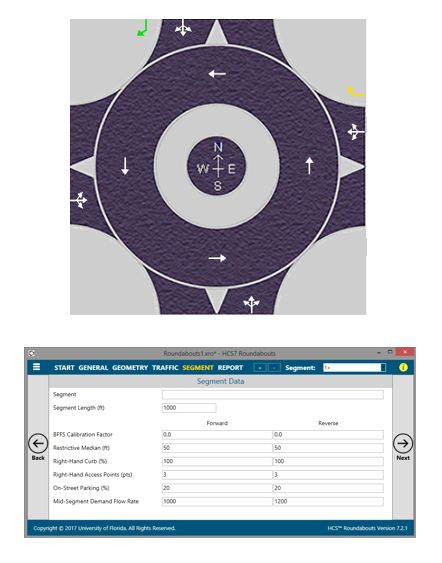
HCS 2022 implements the latest roundabout procedures from the 7th Edition of the Highway Capacity Manual, including the features:
- Updated capacity model with higher average capacities and calibration parameters
- One or multiple-lane roundabouts
- Yielding or Non-Yielding bypass lanes
- Roundabout corridors, with analysis procedures and performance measures for sequential roundabout intersections and the segments between them.
Calculation Mode
Calculation Mode
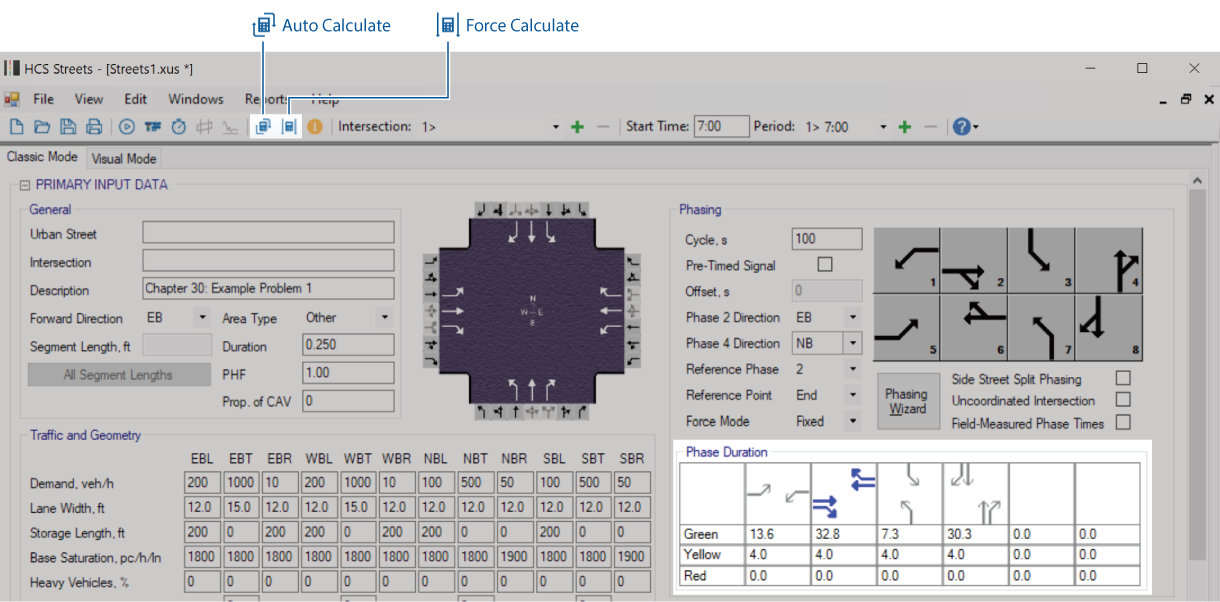
The Streets module in HCS provides the user with two calculation modes.
The Auto-Calculate option is set as the default option for Streets and recommended for most projects,
updating all calculations automatically whenever any input is changed.
When the Auto-Calculate option is off, all model outputs, including Control Delay, Level of Service (LOS), and the final phasing/timing diagrams, are frozen and grayed out until the user pushes the button “Force
Calculations,” as shown below. This option gives the user a higher degree of control when input changes
are applied to the model, which can speed up the inputting process for larger projects and help track
adjustments to the project’s operational performance.
Copy and Paste the HCS Formatted Report to Excel
Copy and Paste the HCS Formatted Report to Excel
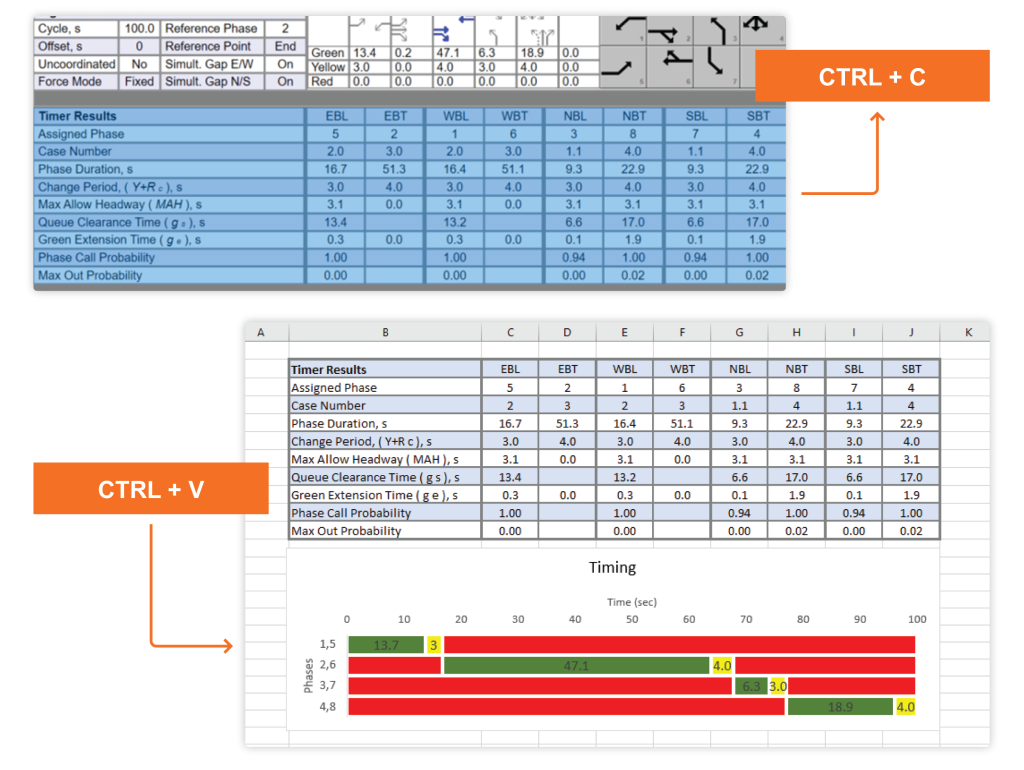
Users can copy selected table data on HCS modules formatted report and paste it directly to Excel, allowing for in-house customization of reports by using the standard MS Windows CTRL+C and CTRL+V keys.
In the example shown above, signal timing results are copied over a preformatted spreadsheet which automatically generates additional graphs.
Modeling Work Zones in Urban Streets
Modeling Work Zones in Urban Streets
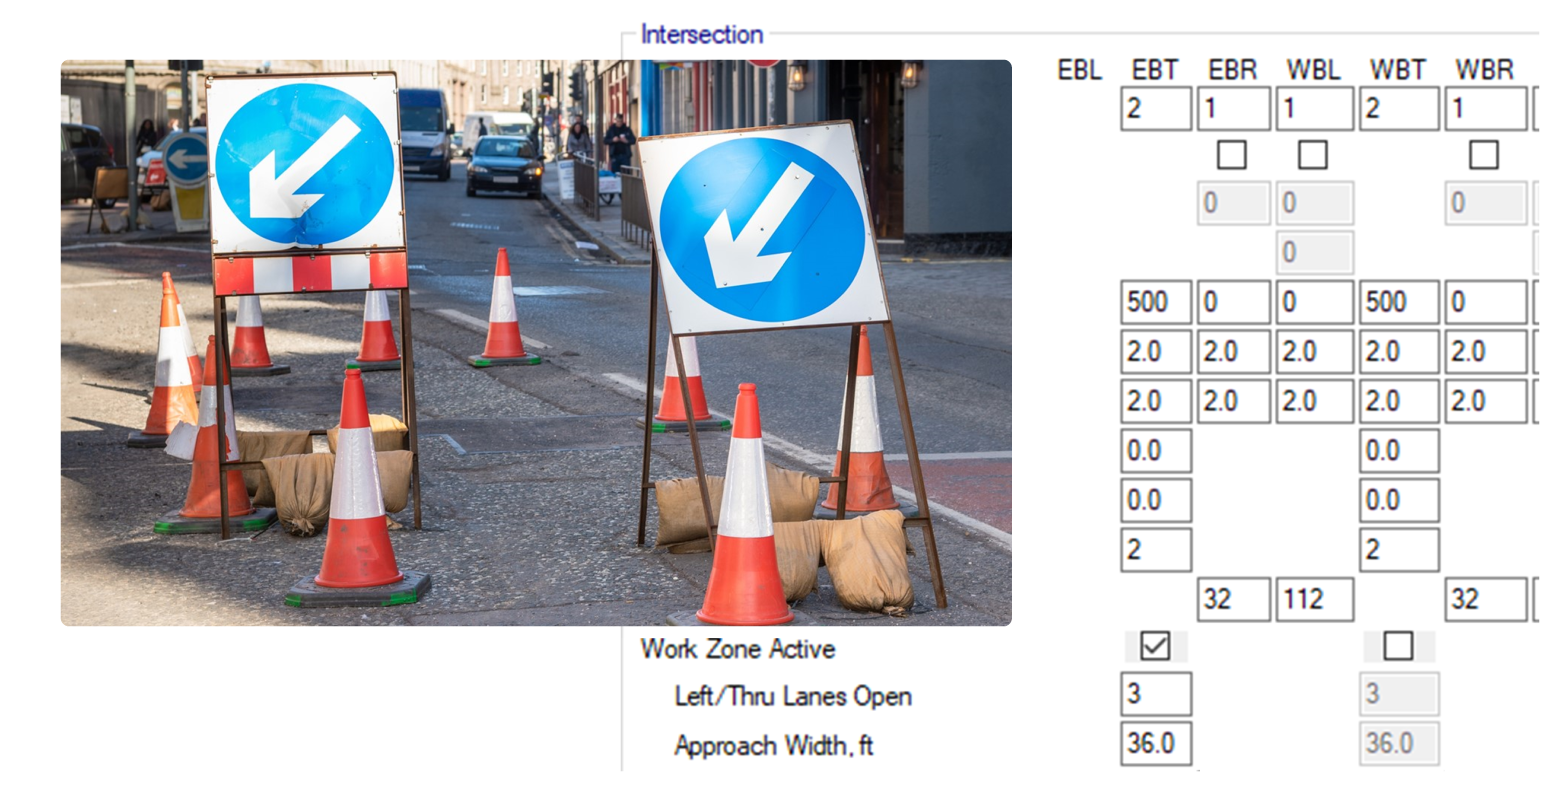
The HCS Streets module can model the impact of work zones on signal saturation flows and capacities based on the number of open lanes and approach width. Expected queues and delays are provided, and can support planning-level or cost-benefit analysis without the need for additional tools.
Modeling Work Zones in Freeways
Modeling Work Zones in Freeways
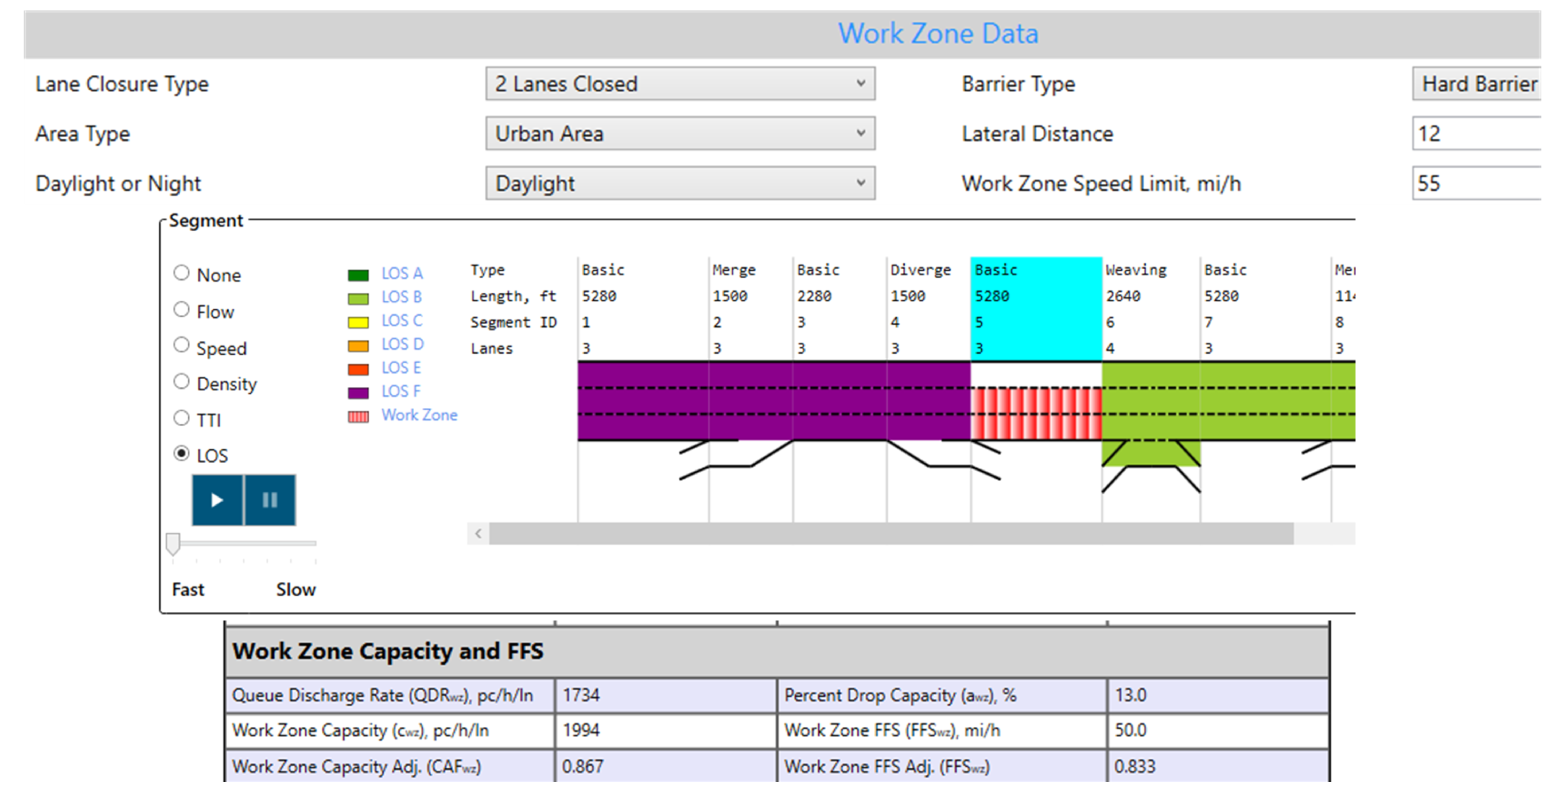
Check out six Work Zone elements impacting freeway operations included in the current Work Zone analysis with HCS:
– Shoulder or up to 2 lane closure
– Urban or rural area
– Daylight or nighttime effects
– Hard or soft barriers
– Lateral Distance to the barrier
– Temporary Speed Limit
Work Zones report and visual outputs are generated, including adjusted capacity and queue discharge rate.
Calibrating Queue Length Percentile
Calibrating Queue Length Percentile
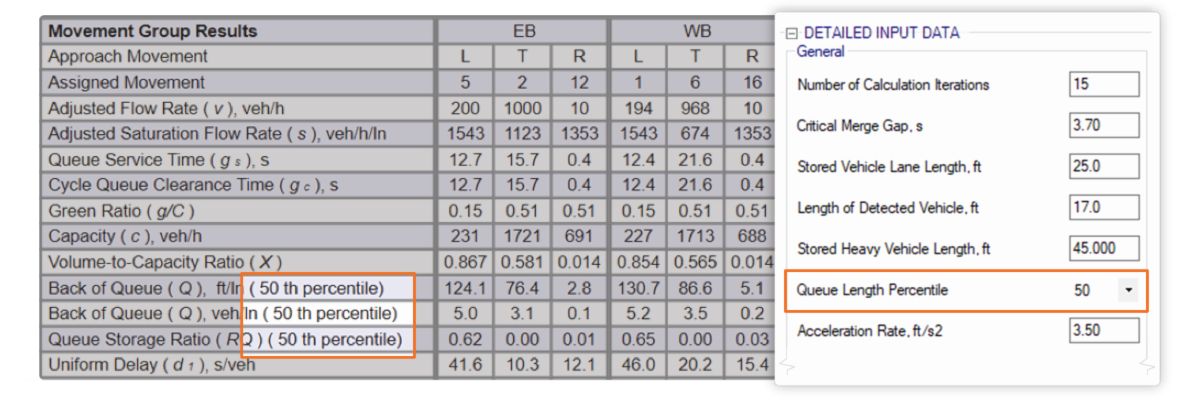
The default percentile of the queue length distribution used to calculate the Back of Queue (Q) length output in HCS Streets is the 50th percentile of the queue length distribution.
It is possible to change this default based on user preferences or agency requirements under the Detailed Input Data section of the user interface.
Percentile values of 50, 85, 90, and 95 can be used. Changes in this input will reflect on the calculations and labels on the formatted report.
HCS Compliance to HCM Chapter 6
HCS Compliance to HCM Chapter 6

In the example shown, a signalized intersection with insufficient storage length for the EBL movement and long spillback was exported to TSIS-CORSIM using a one-click feature on the HCS Streets module, where it is possible to visualize the queue spillback reaching the upstream intersection.
Lane Add and Lane Drop Segments
Lane Add and Lane Drop Segments
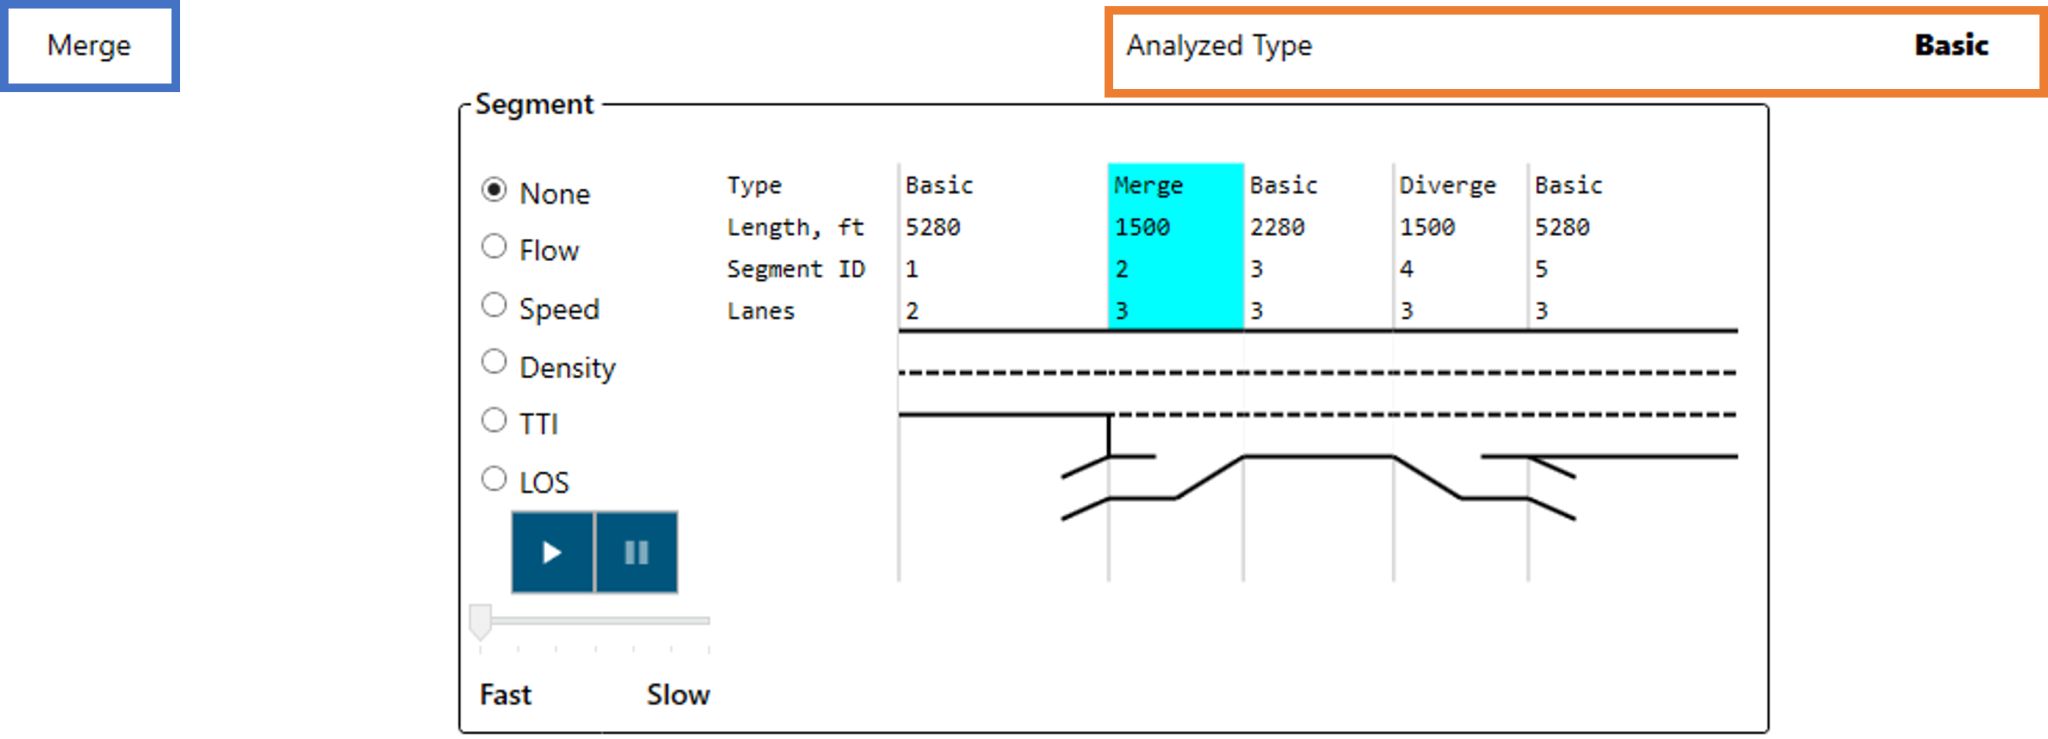
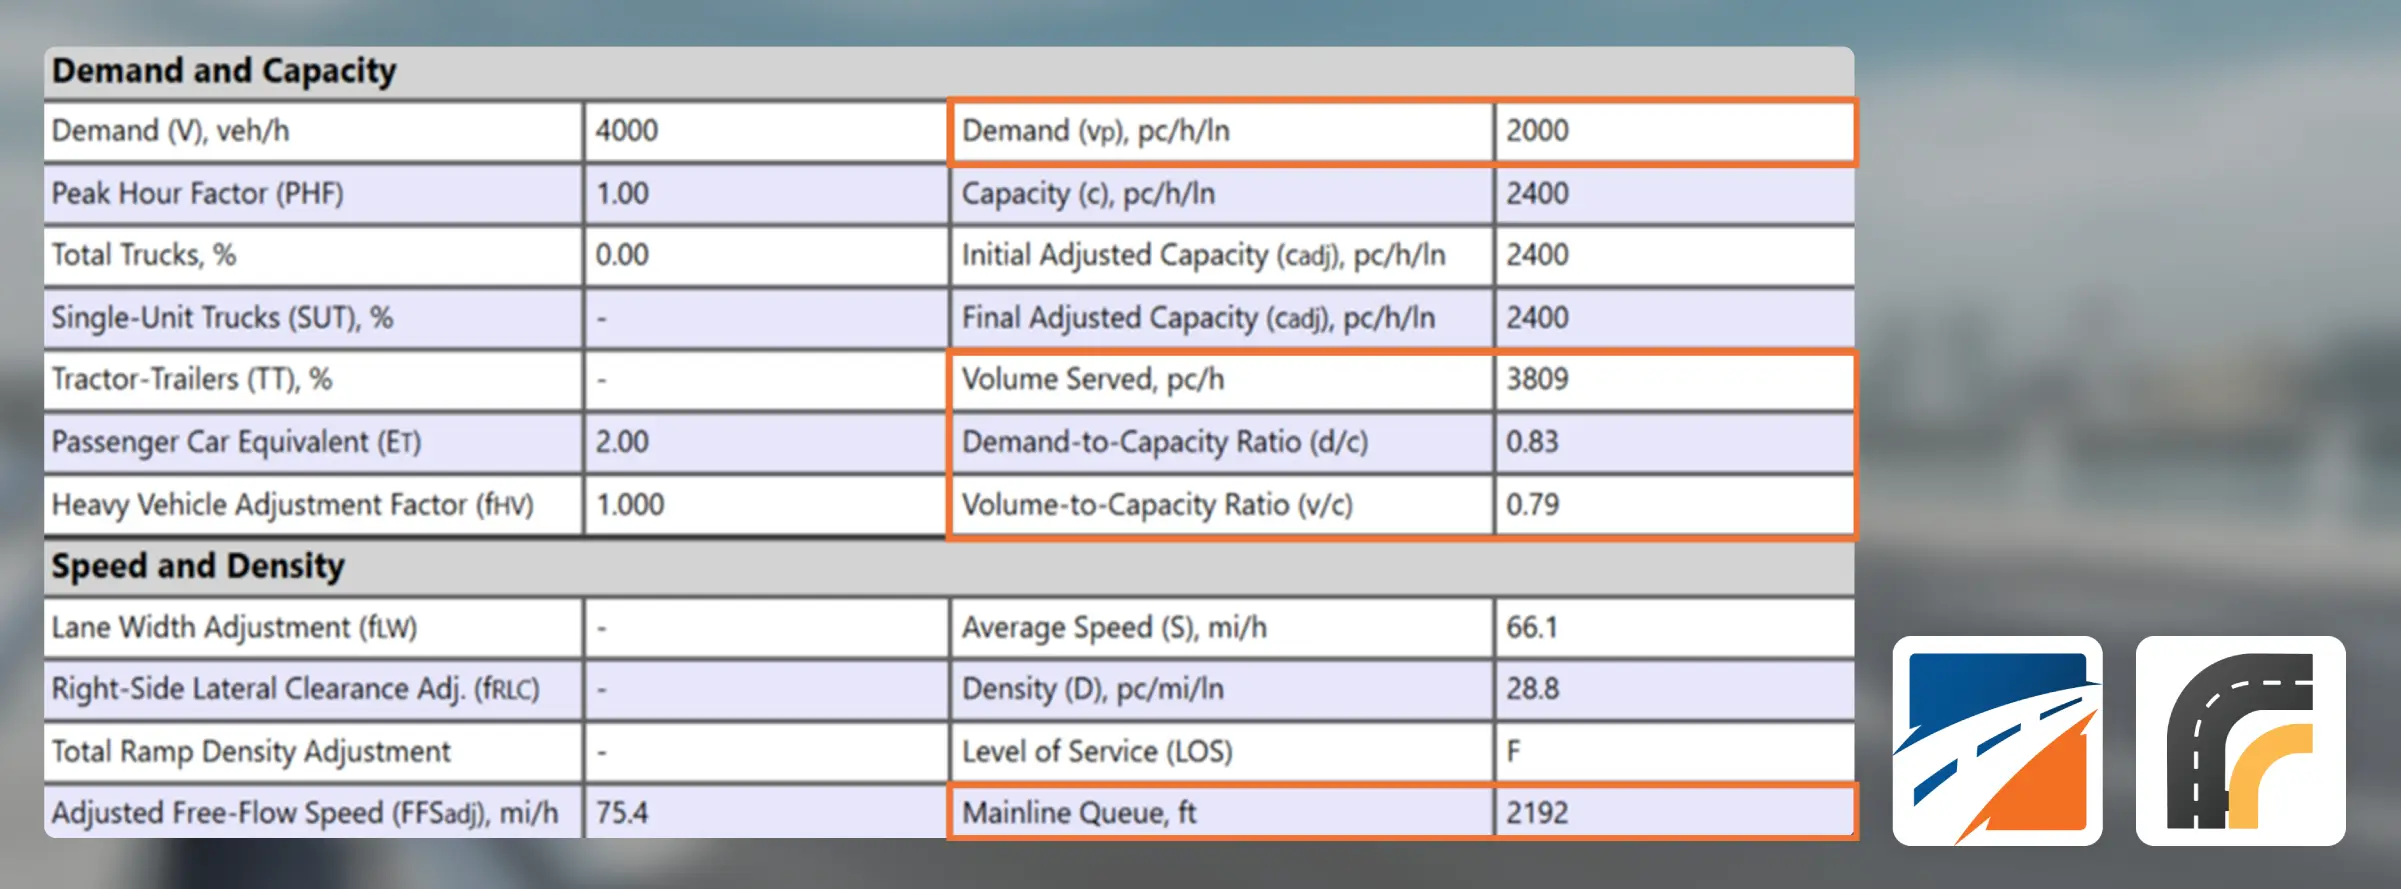
In these cases, the Merge segment should be treated as a Basic Freeway segment with the appropriate number of lanes. The Highway Capacity Software Freeways Facilities module automatically identifies such situations, facilitating the user to model the facility while ensuring HCM compliant analysis.
Information Box
Information Box
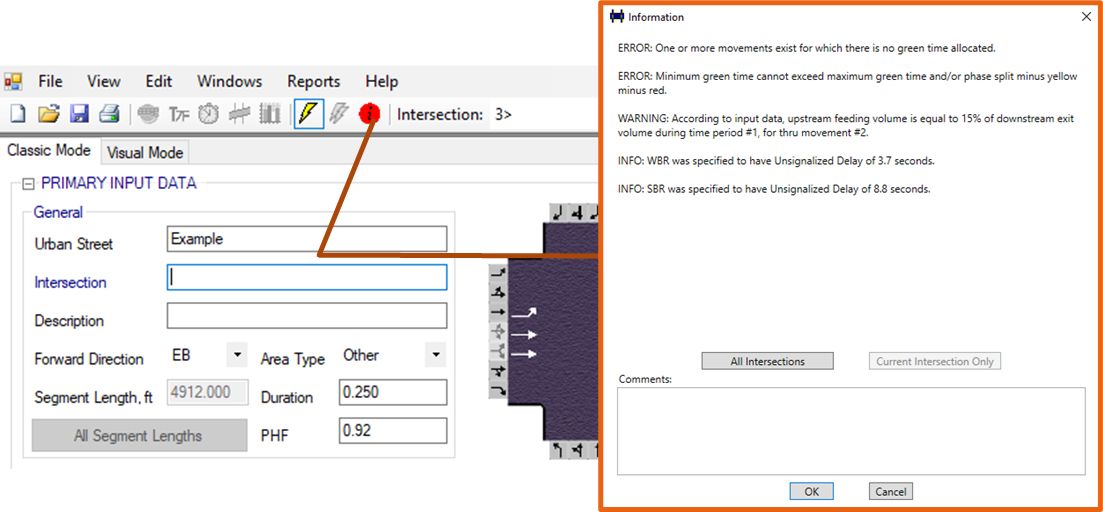
ERROR: there is an issue with the input data, which prevents the methodology from providing valid results.
WARNING: this warns users that HCS procedures will adjust some input data to comply with HCM or software requirements. Users may want to review their inputs, but results will still be produced.
INFO: these messages provide additional information that might be useful. These include cases where default values are changed or optional inputs are used. Results are produced normally.
The message with the most critical level defines the color of the icon displayed on the interface. A Green icon means no warning or errors exist.
Recall Mode for Actuated Signals
Recall Mode for Actuated Signals
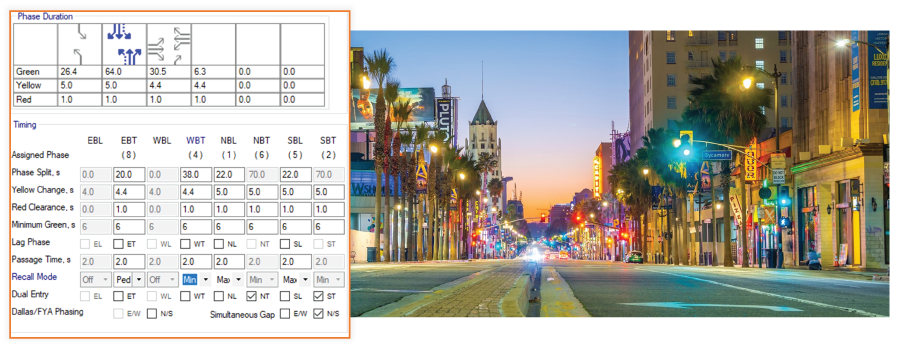
Off: phases may be skipped in the absence of vehicular demand, resulting in average green times close to the minimum.
Min: Service the phase at least until its minimum green interval times out.
Max: Displays green indication for its maximum duration, similar to pre-timed control.
Ped: Place a pedestrian call on the phase and then service the phase for at least the pedestrian walk and clear times.
Modeling Option Lanes in Freeway Weaves
Modeling Option Lanes in Freeway Weaves
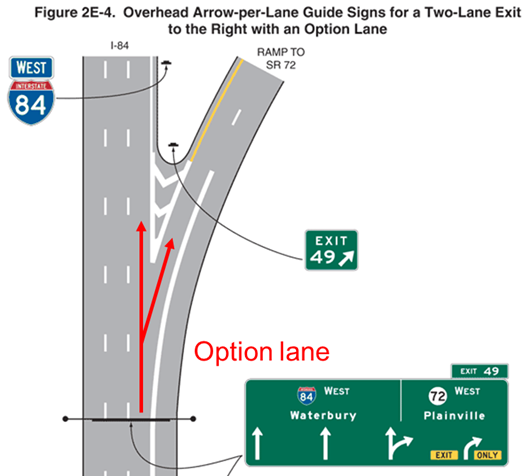
Source: Manual on Uniform Traffic Control Devices (MUTCD-2009)
Modeling freeway weaving – required inputs
The HCM freeway weaving methodology requires inputs related to lane-changing configuration, as follows:
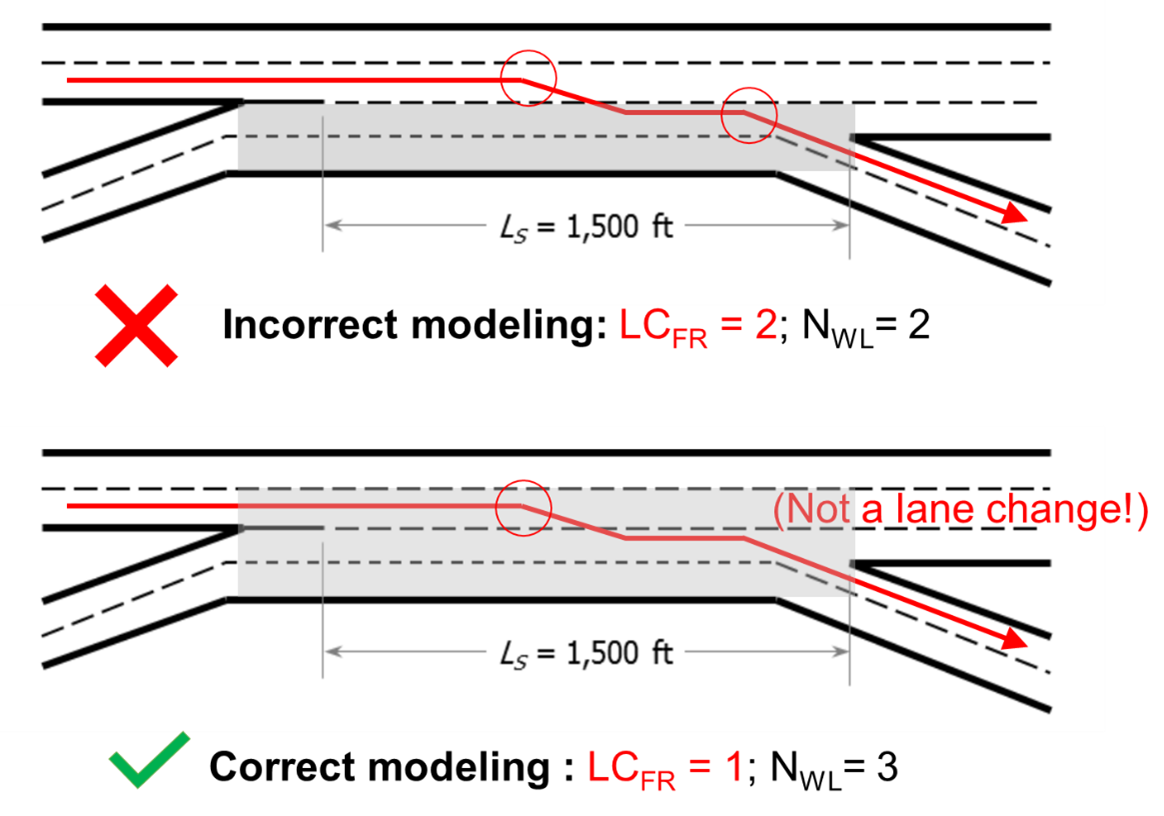
- LCRF = minimum number of lane changes that a ramp-to-freeway weaving vehicle must make to complete the ramp-to-freeway movement successfully.
- LCFR = minimum number of lane changes that a freeway-to-ramp weaving vehicle must make to complete the freeway-to-ramp movement successfully.
- NWL = number of lanes from which a weaving maneuver may be completed with one lane change or no lane changes.
How do option lanes affect the lane-changing inputs?
When an option lane exists, the freeway-to-ramp maneuver at the diverge point can be made without a lane change. If this principle is not observed, the lane-changing inputs will be coded incorrectly, resulting in inaccurate analyses for the entire segment. The figure below illustrates the cases of an incorrect modeling (when the exit maneuver is counted as a lane change) and the correct modeling approach (the exit maneuver is not counted as a lane change):
Efficient Roundabout Modeling
Efficient Roundabout Modeling
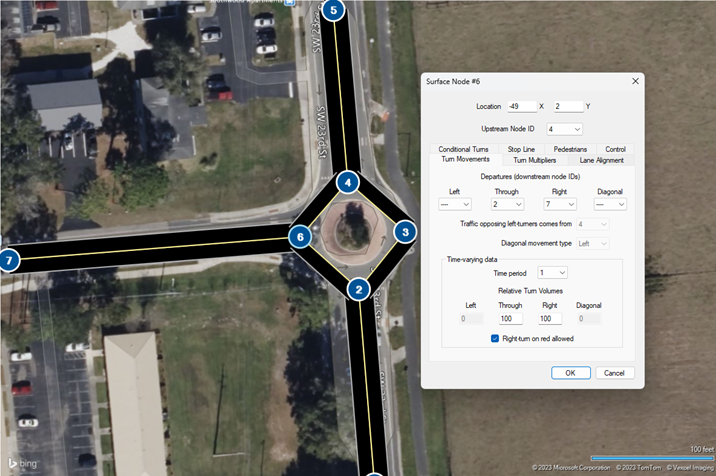
Roundabouts can significantly improve traffic flow and safety, but accurately modeling them requires attention to detail. TSIS-CORSIM is capable of realistically and effectively simulating simple roundabouts. Here’s how to make the most of it:
Detailed Geometry Input: Begin by accurately inputting the roundabout’s geometry. This includes the number of lanes and lane widths for approaching links to the roundabout. Accurate geometry ensures realistic vehicle paths and interactions.
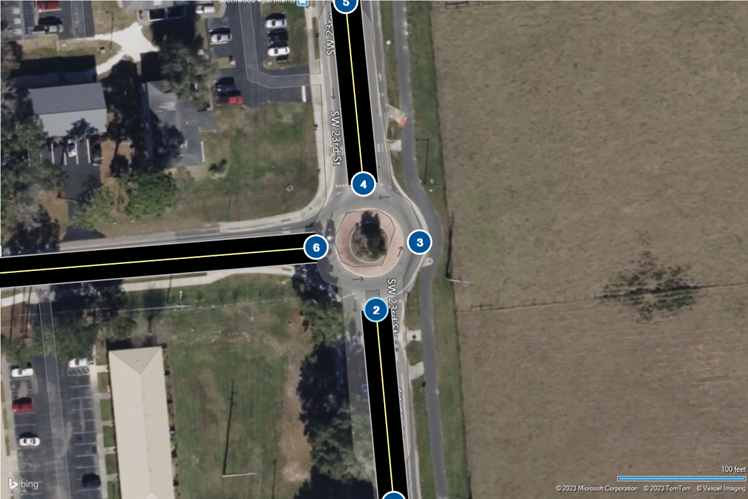
Connecting Nodes and Setting Turning Movements: Connect the four nodes at the roundabout and set the turning movements accurately. This step is crucial for replicating the actual flow of traffic through the roundabout.
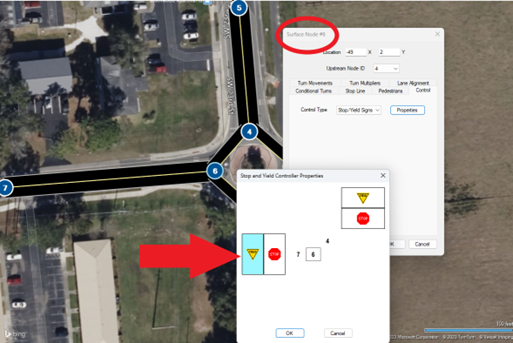
Yield-at-Entry: Ensure that the roundabout’s entry points are set to ‘Yield’ control. This replicates the yielding behavior of drivers at roundabouts, which is crucial for realistic flow and capacity analysis.
Performance Analysis: Utilize the software’s tools to analyze key performance metrics such as delay, queue length, and level of service. This data is crucial for evaluating the roundabout’s efficiency and identifying potential improvements

By following these steps, you can create a detailed and accurate model of a roundabout in TSIS-CORSIM, leading to more effective traffic flow analysis and design solutions.
Keyword Navigation
Smart Maps Keyword Navigation in TSIS-CORSIM
Easily navigate to a specific street, city, zip code, or point of interest (e.g., airport) by entering keywords. TSIS-CORSIM will automatically adjust framing and zoom level to fit the searched reference.
Undo and Redo
Undo and Redo Commands

In the new TSIS-CORSIM 2023, Undo (Ctrl+Z) and Redo (Ctrl+Y) commands are available for all dialogs, including in the Map View interface and Text Editor tool.
Modeling Unsignalized Intersections
Unsignalized Intersection Modeling in TSIS-CORSIM 2023
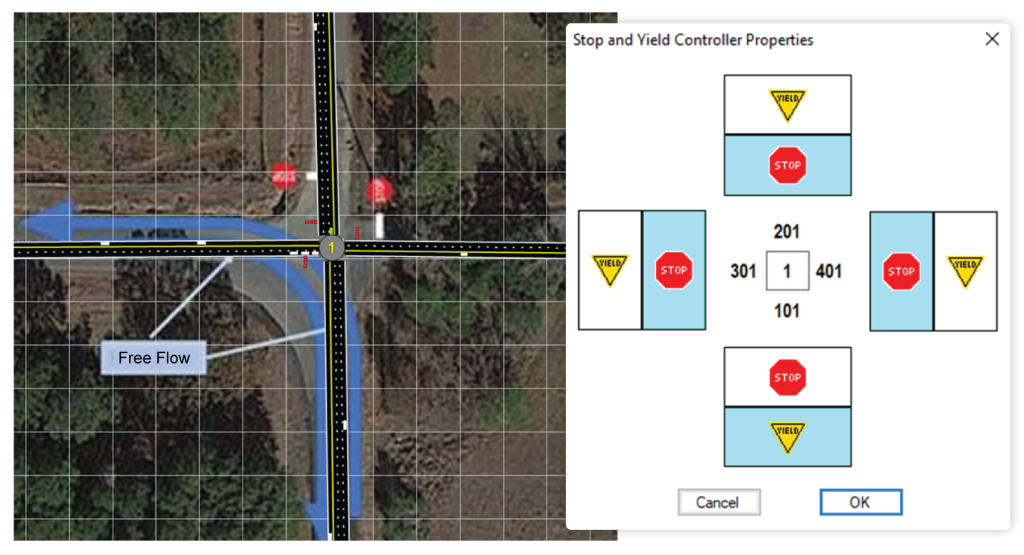
TSIS-CORSIM can open HCS Two-Way Stop-Control (TWSC) files This allows for supplementing the analysis of the Highway Capacity Manual (HCM) methodology when needed.
Different configurations of STOP and Yield signs may be placed on each approach.
The example shows an intersection with adjacent STOP Signs (bended right-of-way). Eastbound thought and left-turning traffic yield to the northbound left turn.
Running Multiple Simulations
Running Multiple Simulations
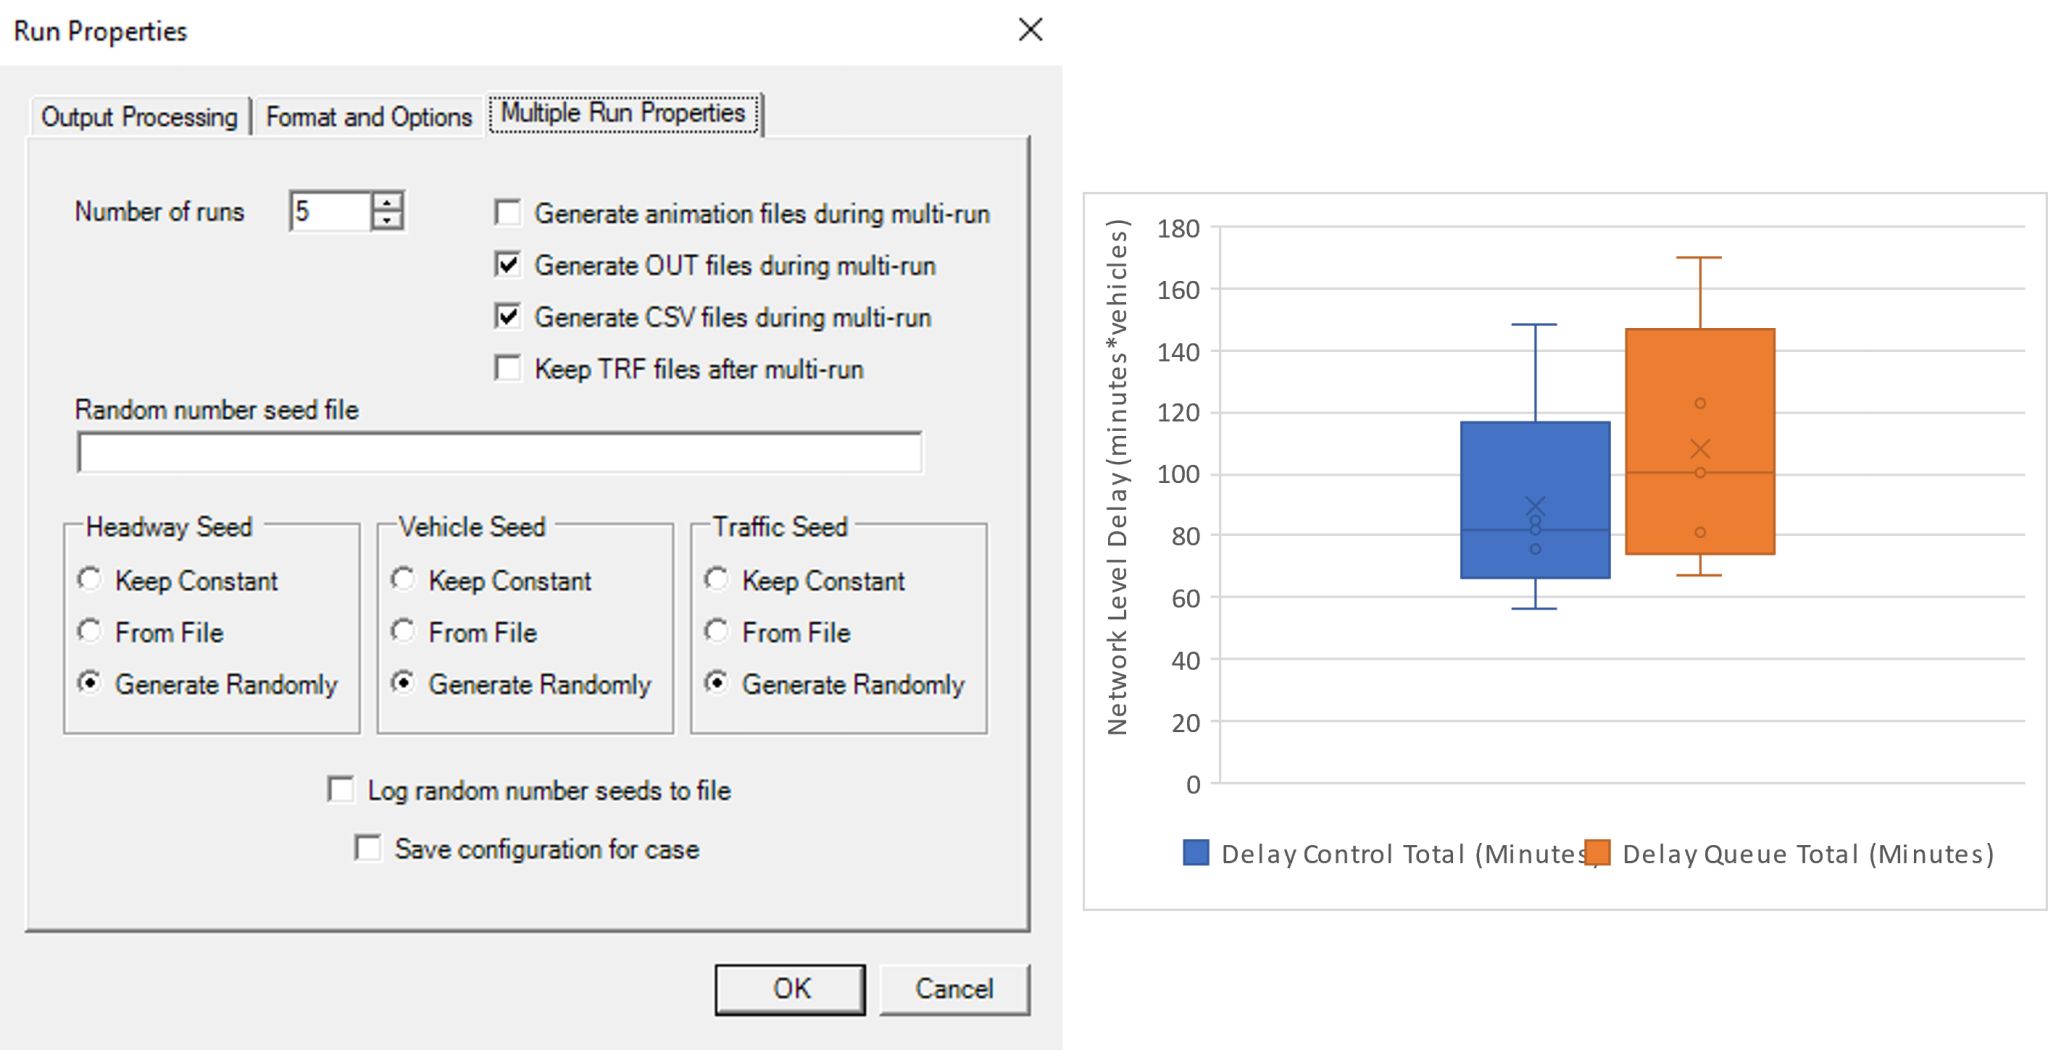
As microsimulation is stochastic in nature, TSIS-CORSIM can quickly provide descriptive statistics for any model.
By using the multi-run command, the user may run several replications of the model with randomly generated seeds.
STOP-Controlled Intersection
STOP-Controlled Intersection
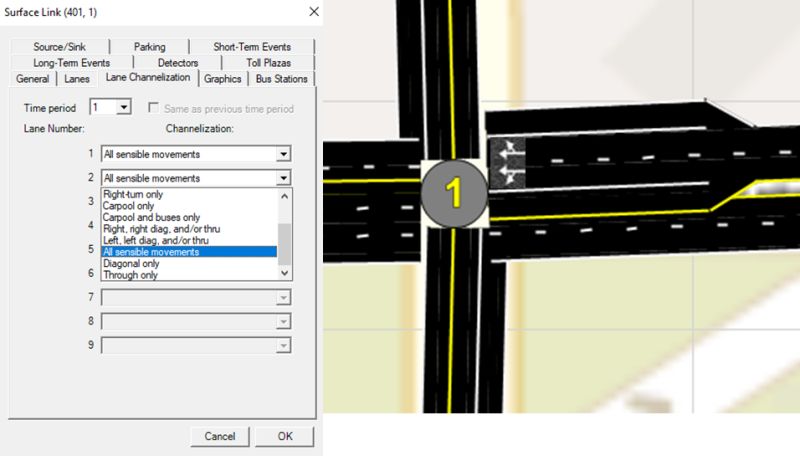
TSIS-CORSIM can model shared lanes adjacent to exclusive turn pockets (A HCM limitation) by using the correct channelization settings.
For surface street links, Option 9 on the channelization window (All sensible movements) will allow right turns from the rightmost full lane even if there is a right-turn pocket. Similarly, left turns can take place from the leftmost full lane even if there is a left-turn pocket, as shown on the Westbound approach of the intersection in the figure.
Link Curvature Visualization
Link Curvature Visualization
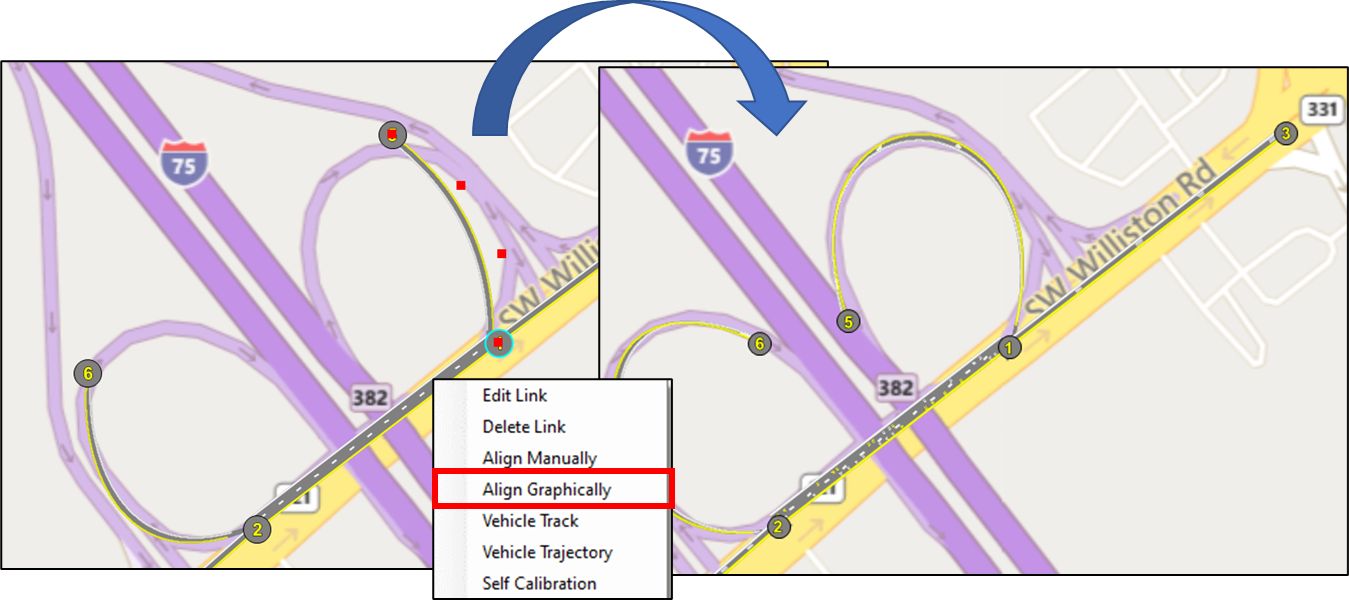
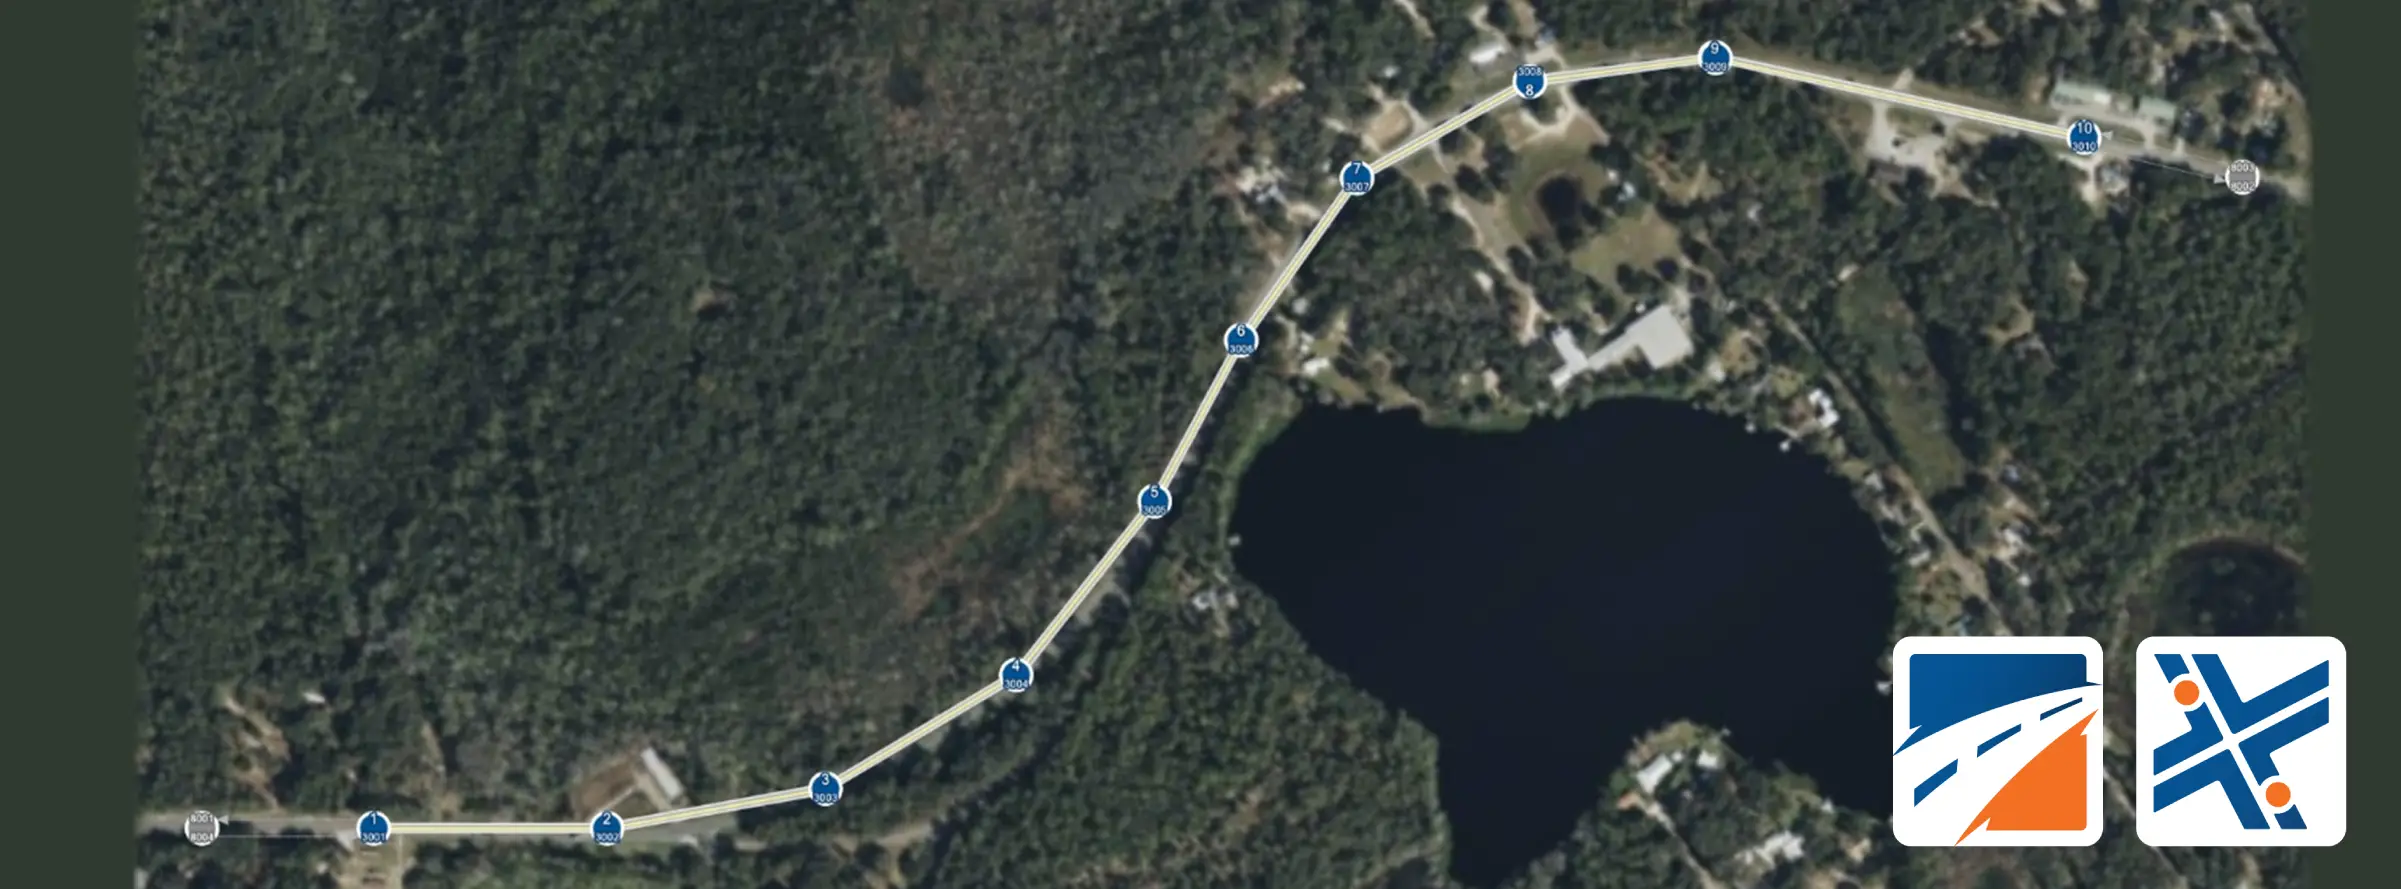
Easily add curvature to TSIS-CORSIM links by dragging curve points as you would do for any Windows curve shape.
Find Tool
Find Tool
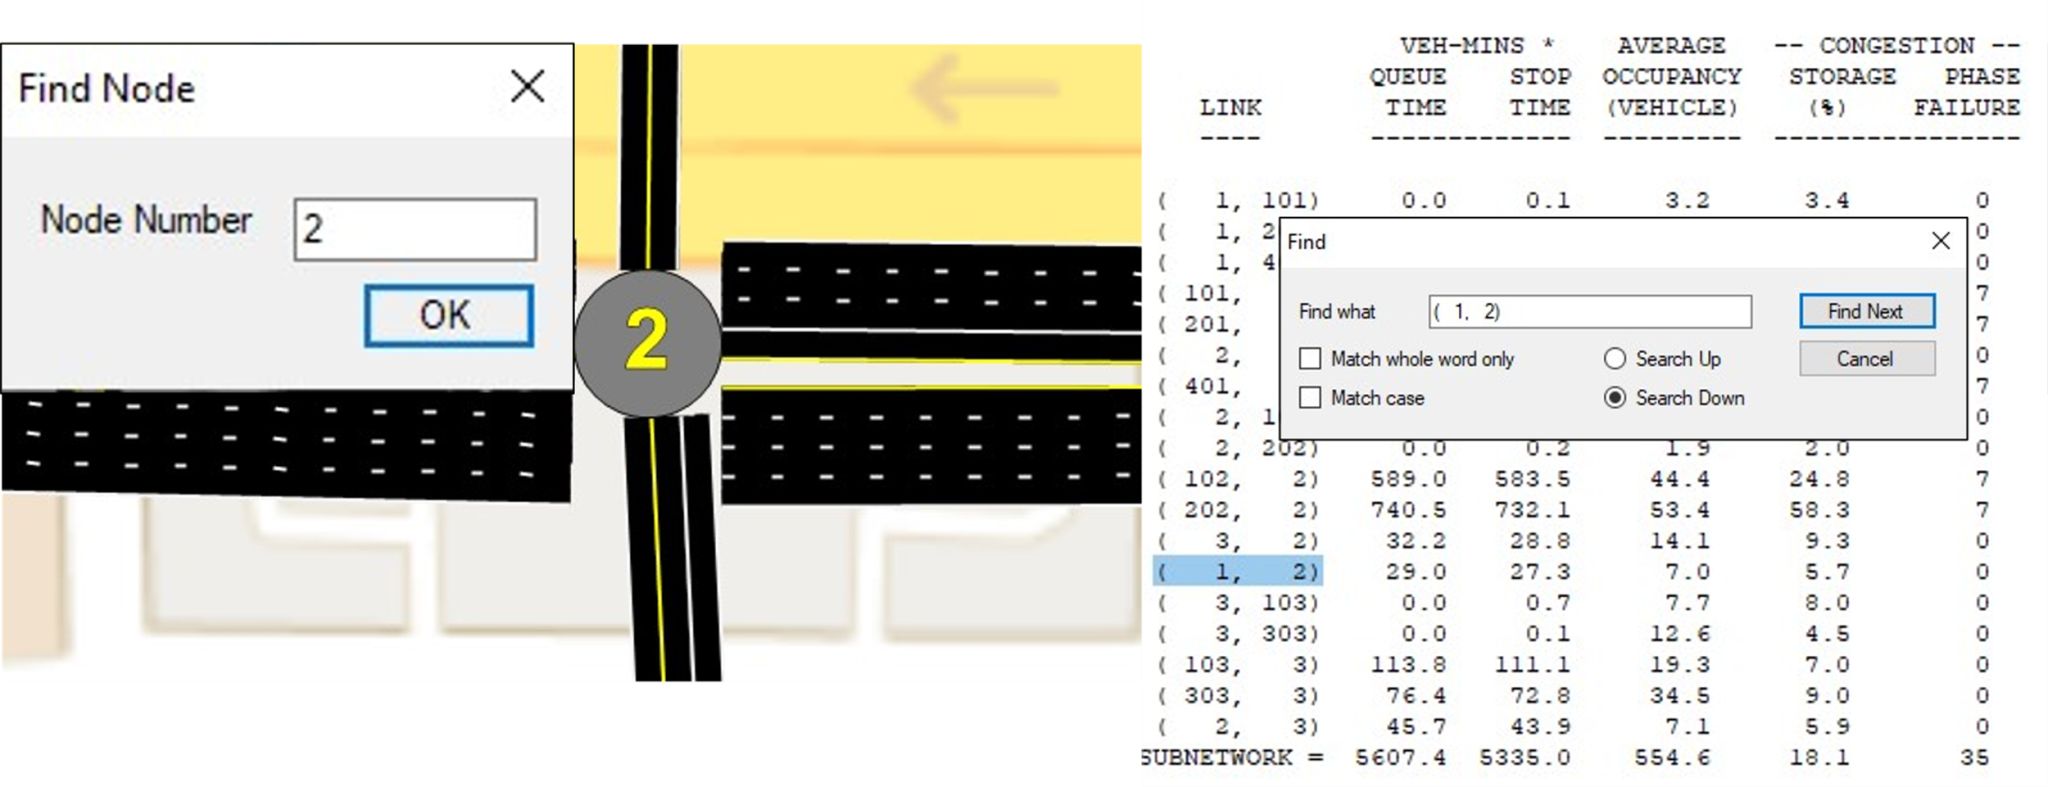
The Find tool (Ctrl+F) in TSIS-CORSIM allows the user to quickly
1. On the map mode, find and navigate to the chosen node number
2. On the report screen, find and quickly jump to the desired label or value
Modeling Toll Lanes
Modeling Toll Lanes
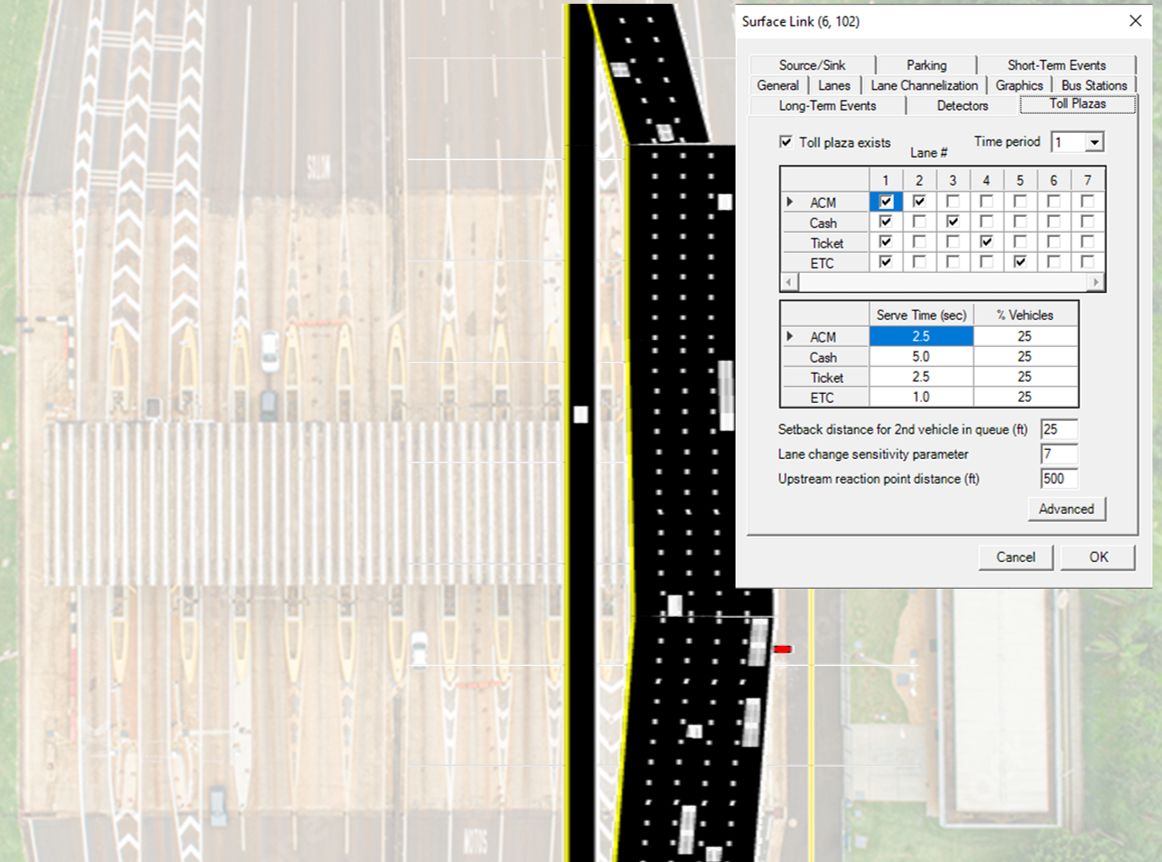
#TSIS_CORSIM can model toll lanes with different settings:
– Automatic vs manual booths
– Plaza lane-changing logic
– Free lanes
– Temporary lane closures
– Vehicle restriction on selected lanes
– Animations and all lane-based MOEs available
– May be used to represent other types of booths (ex.:facility entrances)
Modeling Blockages in CORSIM
Modeling Lane Blockages in CORSIM
 Lane blockages can be modeled in CORSIM in two different ways.
An HOV lane can be used to simulate a lane blockage by defining it as closed to all traffic. By opening the HOT lane to all traffic, CORSIM resumes normal operations.
Incidents are another way to simulate lane blockage. Incidents are specified in the first time period but can last longer than a time period. The max number of incidents for the entire simulation is 100, which can be spread out through the simulation as needed. Each subsequent incident can have different behavior, and parallel incidents can be modeled to represent, for example, a blockage in one lane and rubbernecking in adjacent lanes. Queuing information is obtained from detectors or upstream from the blockage.
TSIS 6 History
TSIS 6 History
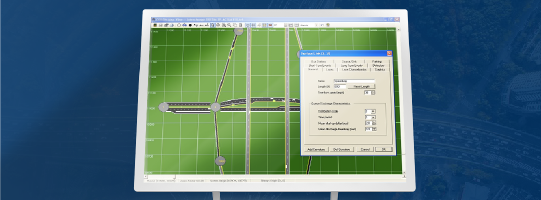
TSIS 6.0 was originally released in January 2007. In the next three years, TSIS 6.1 and TSIS 6.2 introduced several improvements including TSIS Next interface, 9-lane NETSIM approaches, left-hand drive, new sample networks, signal pre-emption for actuated controllers, traffic assignment for actuated controllers, two-lane rural highways with passing and no-passing zones, vehicle type O-D volumes in FRESIM, animation plus input editing in TSIS Next, new sample networks.
The latest release of TSIS (TSIS 6.3) combined CORSIM and TRANSYT-7F signal optimization program in one product. Other updates included a new Streets Editor, HOT lanes, advanced toll plazas, interactive lane alignment in TSIS Next and adaptive cruise control.
Merging Logic
Merging Logic

If on-ramp vehicles are having trouble entering the mainline or if on-ramp vehicles are reaching the end of the acceleration lane, this can be handled by increasing the percentage of drivers who will cooperate with a merging vehicle. The default value is only 20%. This parameter works with the anticipatory lane change logic to allow vehicles to merge more smoothly.
Information Window
Freeway Speed Lane Changes
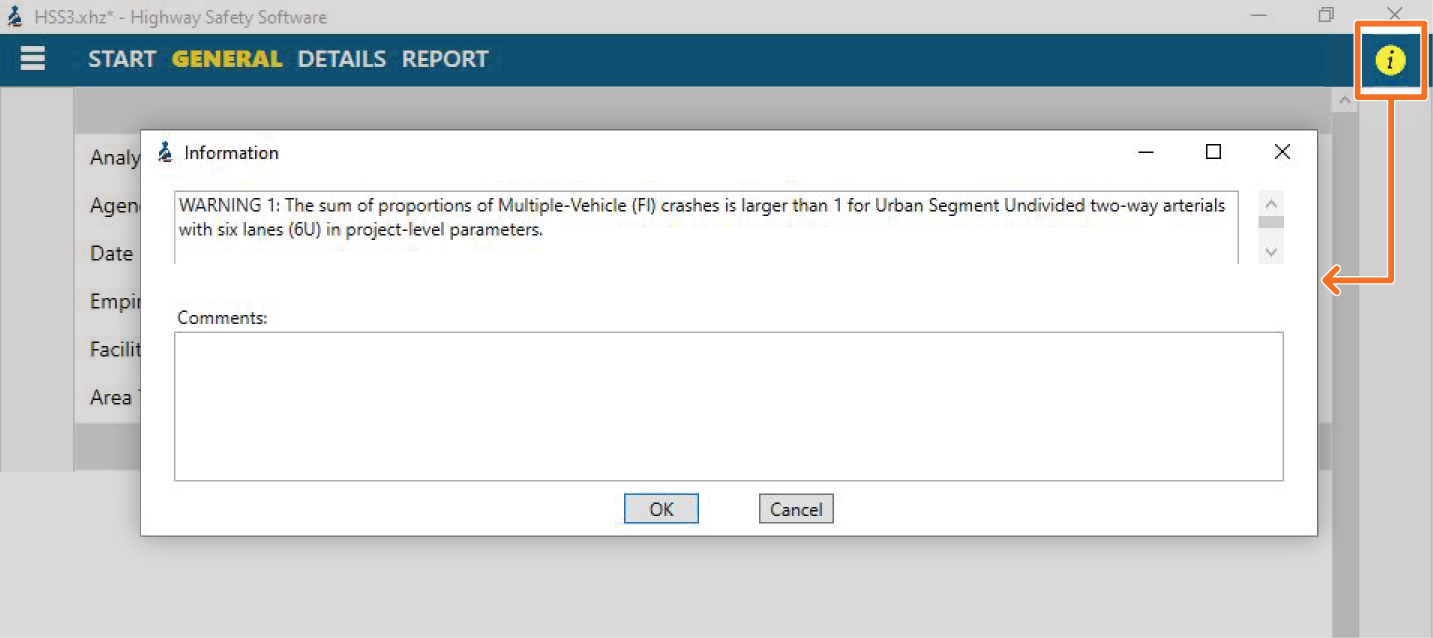
In HSS, the color-coded “Information” button (shown circled in the upper right corner) will inform the user of inputs that may affect their results. The button will turn from green to yellow to indicate there is a warning. Clicking on the “Information” button will provide a list of active warnings and their descriptions. Here is a list of the types of warnings you may see in HSS:
- The total proportion of single-vehicle crashes is larger than 1 for the urban section.
- The total proportion of multiple-vehicle crashes is larger than 1 for the urban section.
- The total proportion of crashes is larger than 1 for the urban section.
- The total proportion of crashes is larger than 1 for the global parameter.
- The total proportion of single-vehicle crashes is smaller than 1 for the urban section.
- The total proportion of multiple-vehicle crashes is smaller than 1 for the urban section.
- The total proportion of crashes is smaller than 1 for the urban section.
- The total proportion of crashes is smaller than 1 for the global parameter.
- The ramp length is outside of the applicable range.
Freeway Speed Lane Changes
Freeway Speed Lane Changes
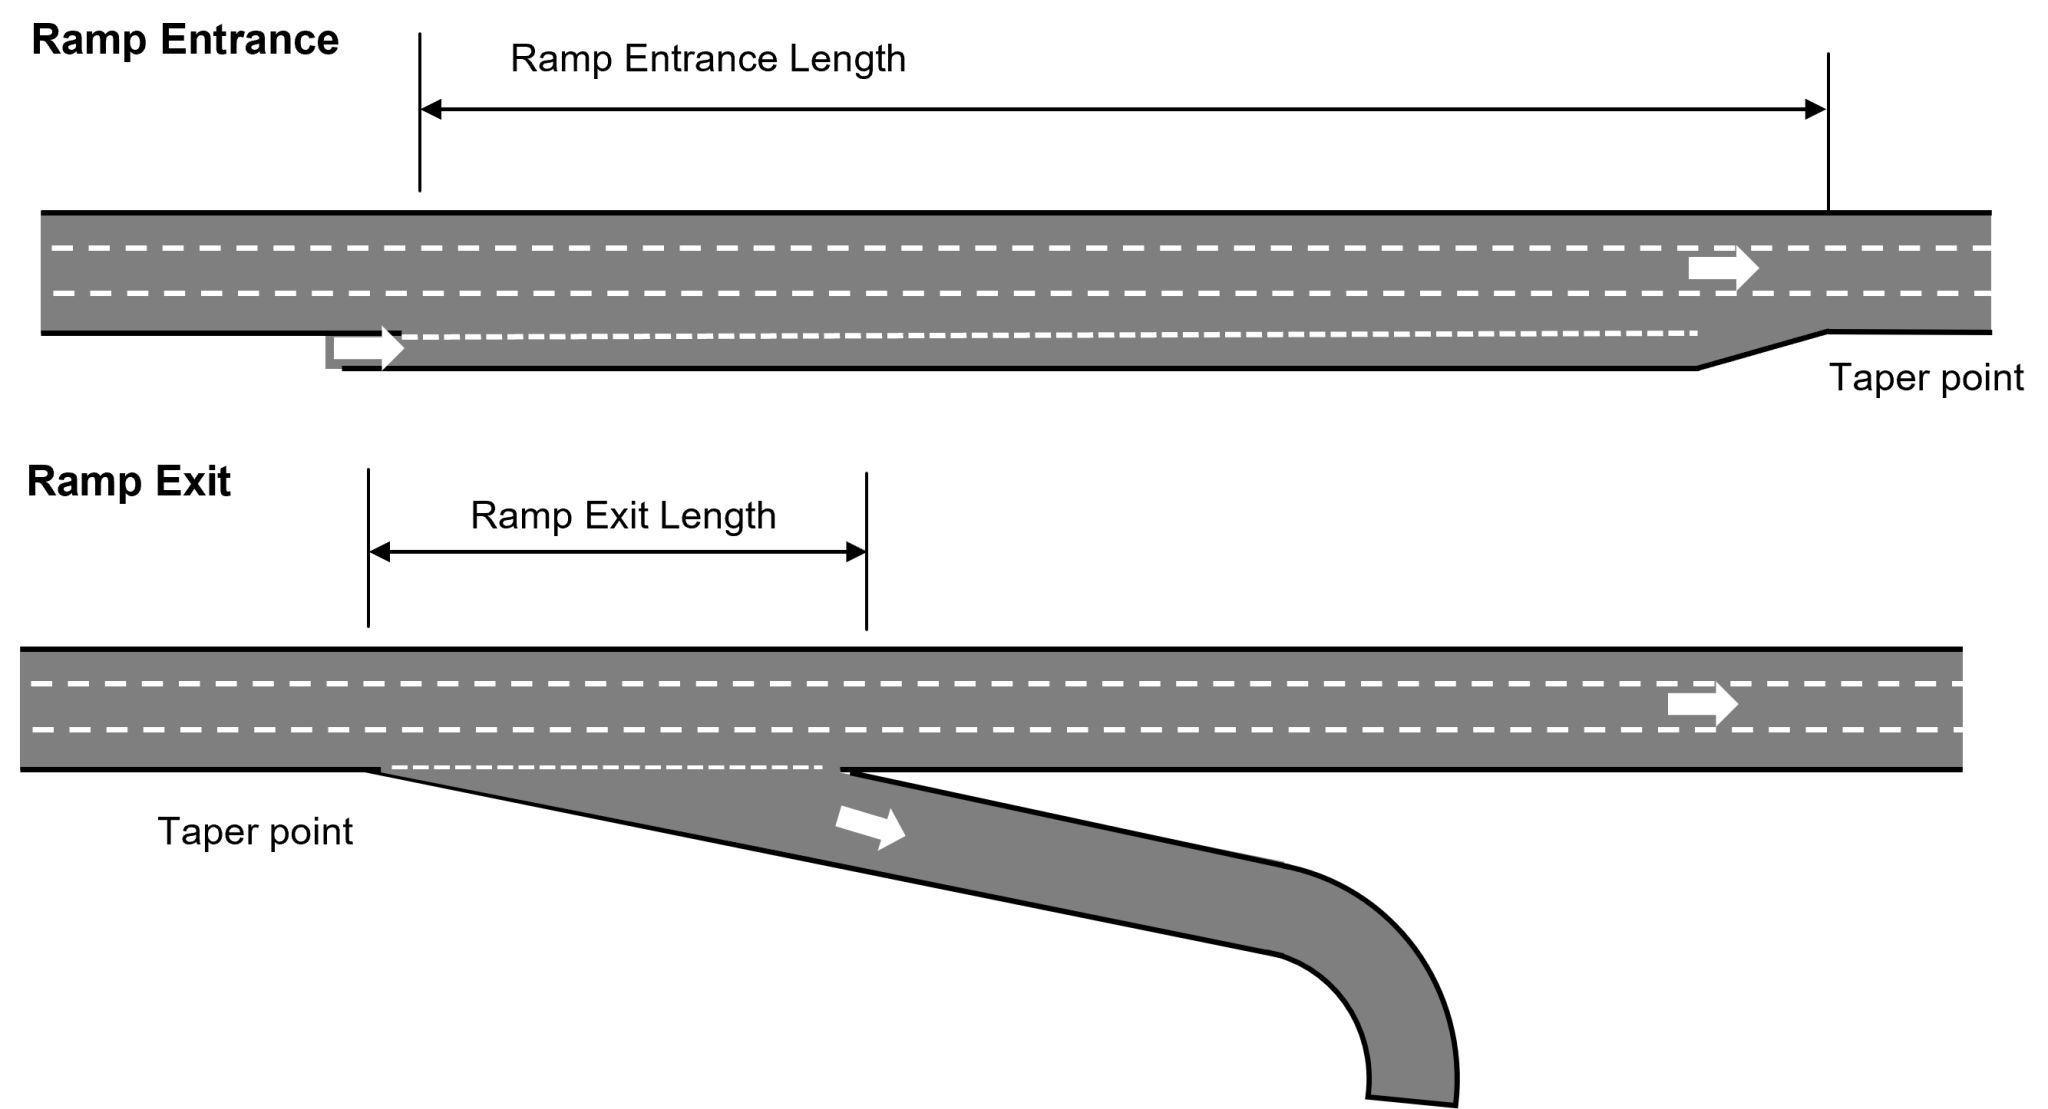
The Highway Safety Manual can predict crashes for freeway speed-change lanes (entrance and exit points). It covers the area between the gore point and the taper point and includes vehicles in the speed-change lane or in the freeway lanes on the same side of the freeway as the speed-change lane, as shown in the figure.
Crash prediction models for Freeways were developed as part of the 2014 Supplement of the HSM and are already implemented in the Highway Safety Software.
Empirical Bayes Method
Empirical Bayes Method
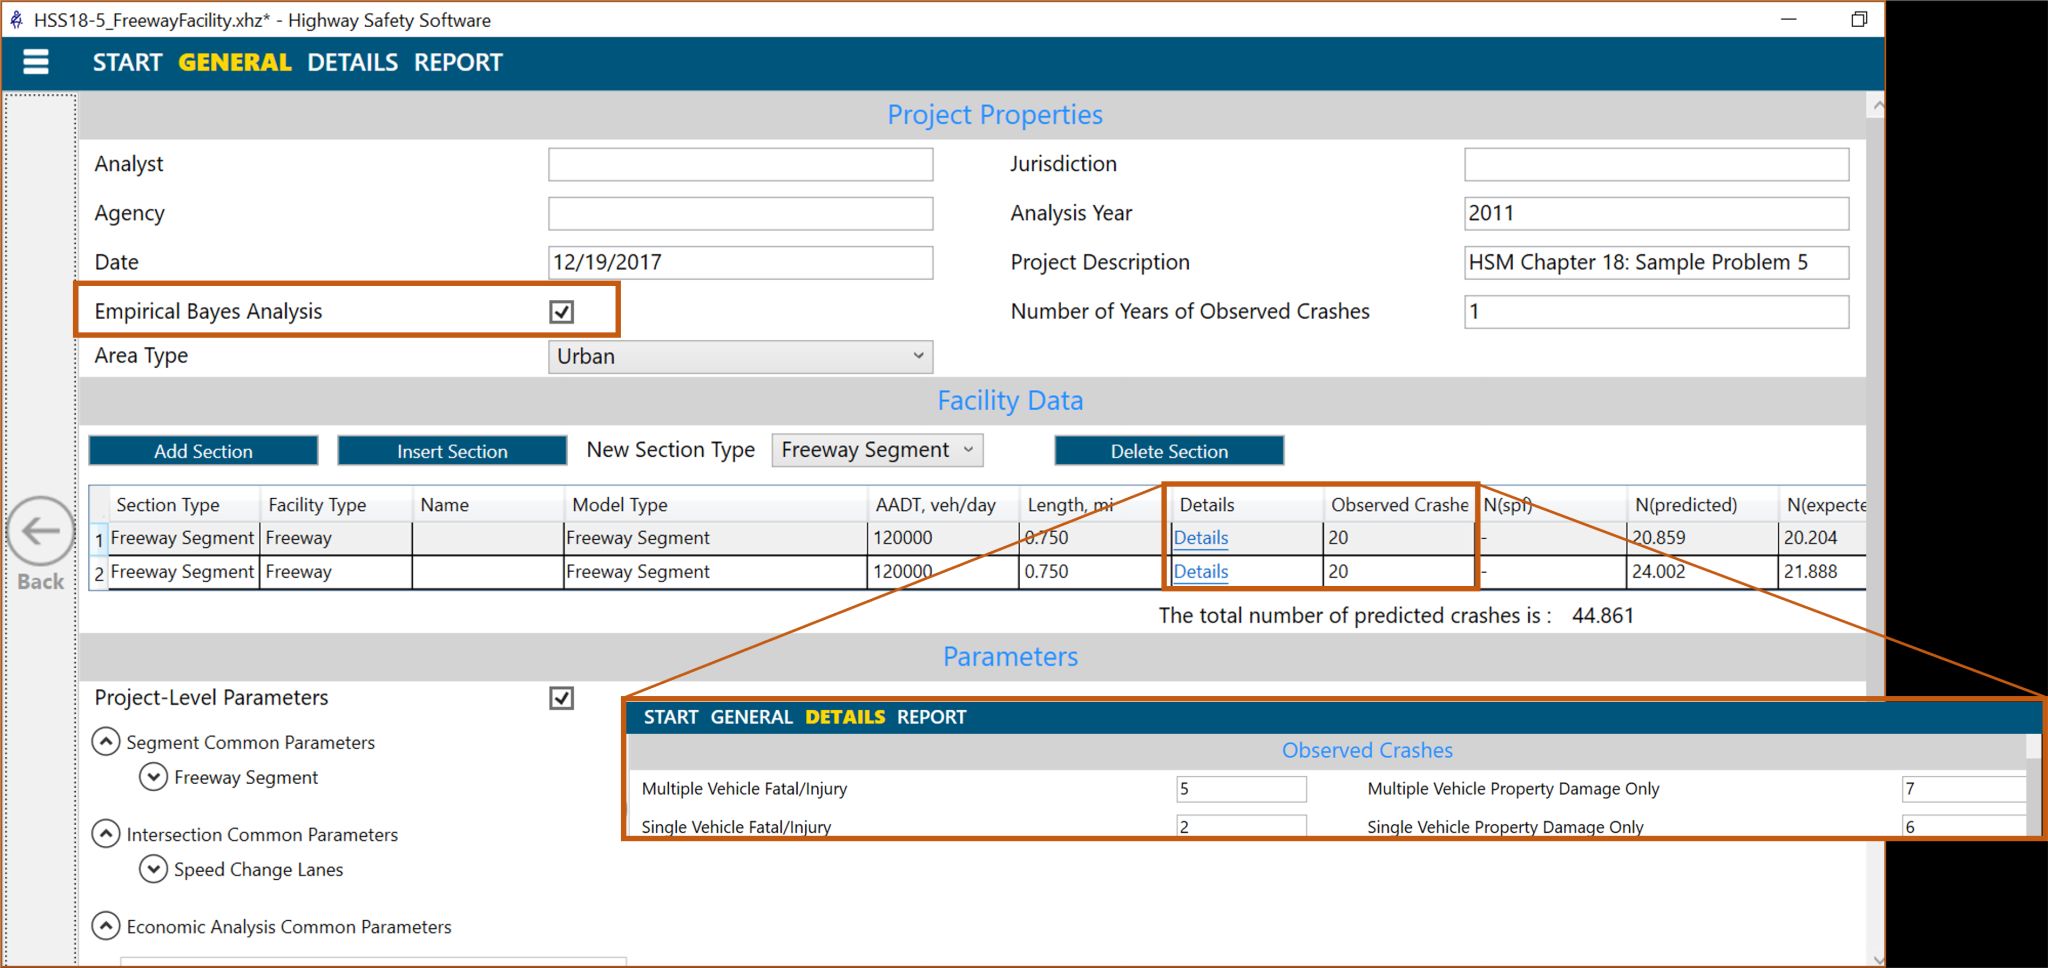
The Empirical Bayes method can be used for correcting the regression-to-mean bias to the application of the Safety Performance Functions (SPFs). The Empirical Bayes Method consists of weighting the crash obtained by combining two sources: accident history and a safety prediction model.
Use Highway Safety Software – HSS to improve your estimation, as shown in the image.
Type B Weavings
Type B Weavings
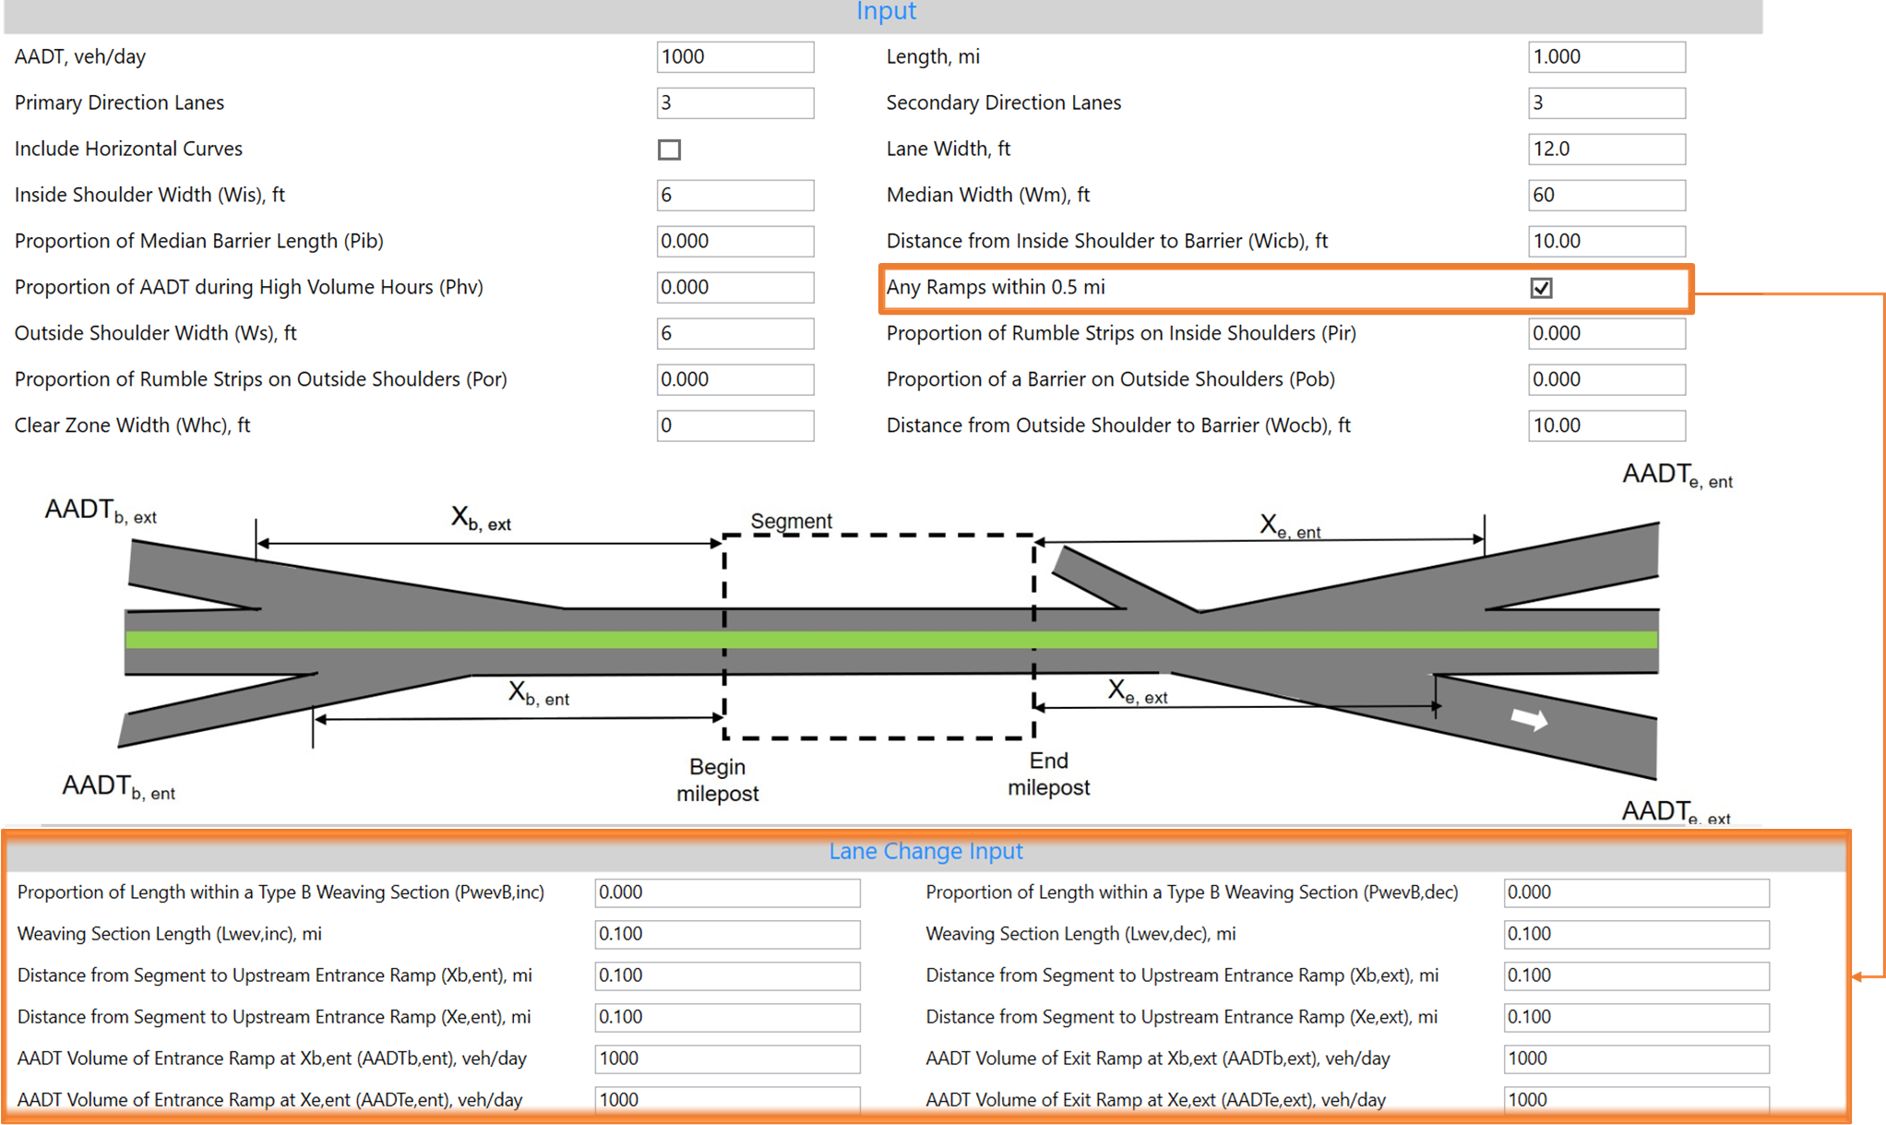
If you have a Type B weaving, make sure to check “Any Ramps within 0.5 mi” in HSS to enable weaving-related inputs.
Nighttime Crashes
Nighttime Crashes
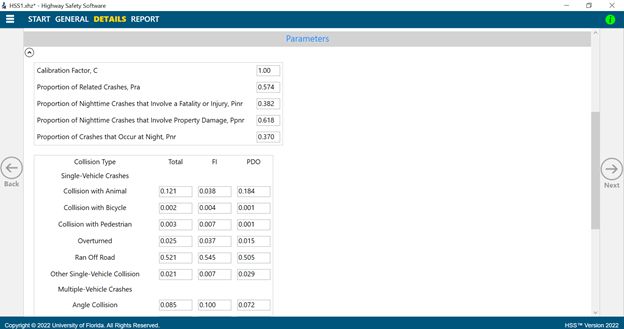
The base condition for Safety Performance functions in a facility is the absence of lighting. Thus, nighttime effects on crashes are addressed in HSM/HSS through CMFs. It is possible to use calibrated proportions in Highway Safety Software to increase model accuracy.
Intersection Crash Definition
Intersection Crash Definition
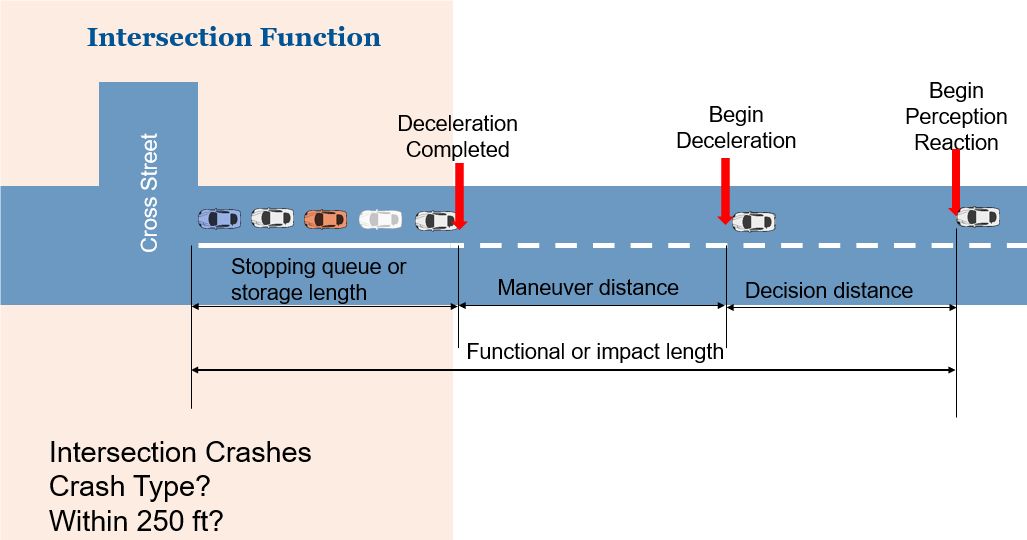
According to HSM, the definition of an intersection crash varies between agencies. It can be considered an intersection crash that occurs within the intersection crosswalk limits or physical intersection area. Other agencies consider all crashes within a specified distance, such as 250 ft, from the center of an intersection to be intersection crashes. However, some crashes occurring within 250 ft of an intersection cannot be considered intersection crashes since some of these may have happened regardless of intersection existence. When evaluating conditions and seeking solutions, consideration should be given to these differences in definitions.
Articles
A Closer Look at the New HSS Pedestrian & Bicycle Methods
Dr. Fabio Sasahara2026-01-09T21:32:39+00:00Categories: HSS|
The 2026 update of the Highway Safety Software introduces [...]
Converting Highway Capacity Analysis Files to Traffic Simulation Format
Dr. Ehsan Amini2025-12-17T16:27:09+00:00Categories: HCS, TSIS-CORSIM|
The Highway Capacity Manual (HCM) provides comprehensive methodologies for [...]
Understanding New Freeway Facility Reports in HCS
Dr. Fabio Sasahara2025-12-10T23:08:27+00:00Categories: HCS|
The Highway Capacity Manual (HCM) allows segment level evaluation [...]
Using the F1 Tool for Quick Help on Software Inputs
Dr. Fabio Sasahara2025-10-08T15:20:25+00:00Categories: HCS, Quick Reads|
Even with the intuitive user interface in HCS and HSS, [...]
Lane Width Impact in HCM Methods
Gustavo Zschaber2025-08-25T21:38:11+00:00Categories: HCS|
Lane width is a key factor in roadway analysis, and [...]
Update of Highway Capacity Manual: Merge, Diverge, and Weaving Methodologies
Dr. Fabio Sasahara2026-01-08T20:09:37+00:00Categories: HCS|
Released in 2023, NCHRP Research Report 1038 (Research Project 07-26) [...]
