
Dr. Fabio Sasahara
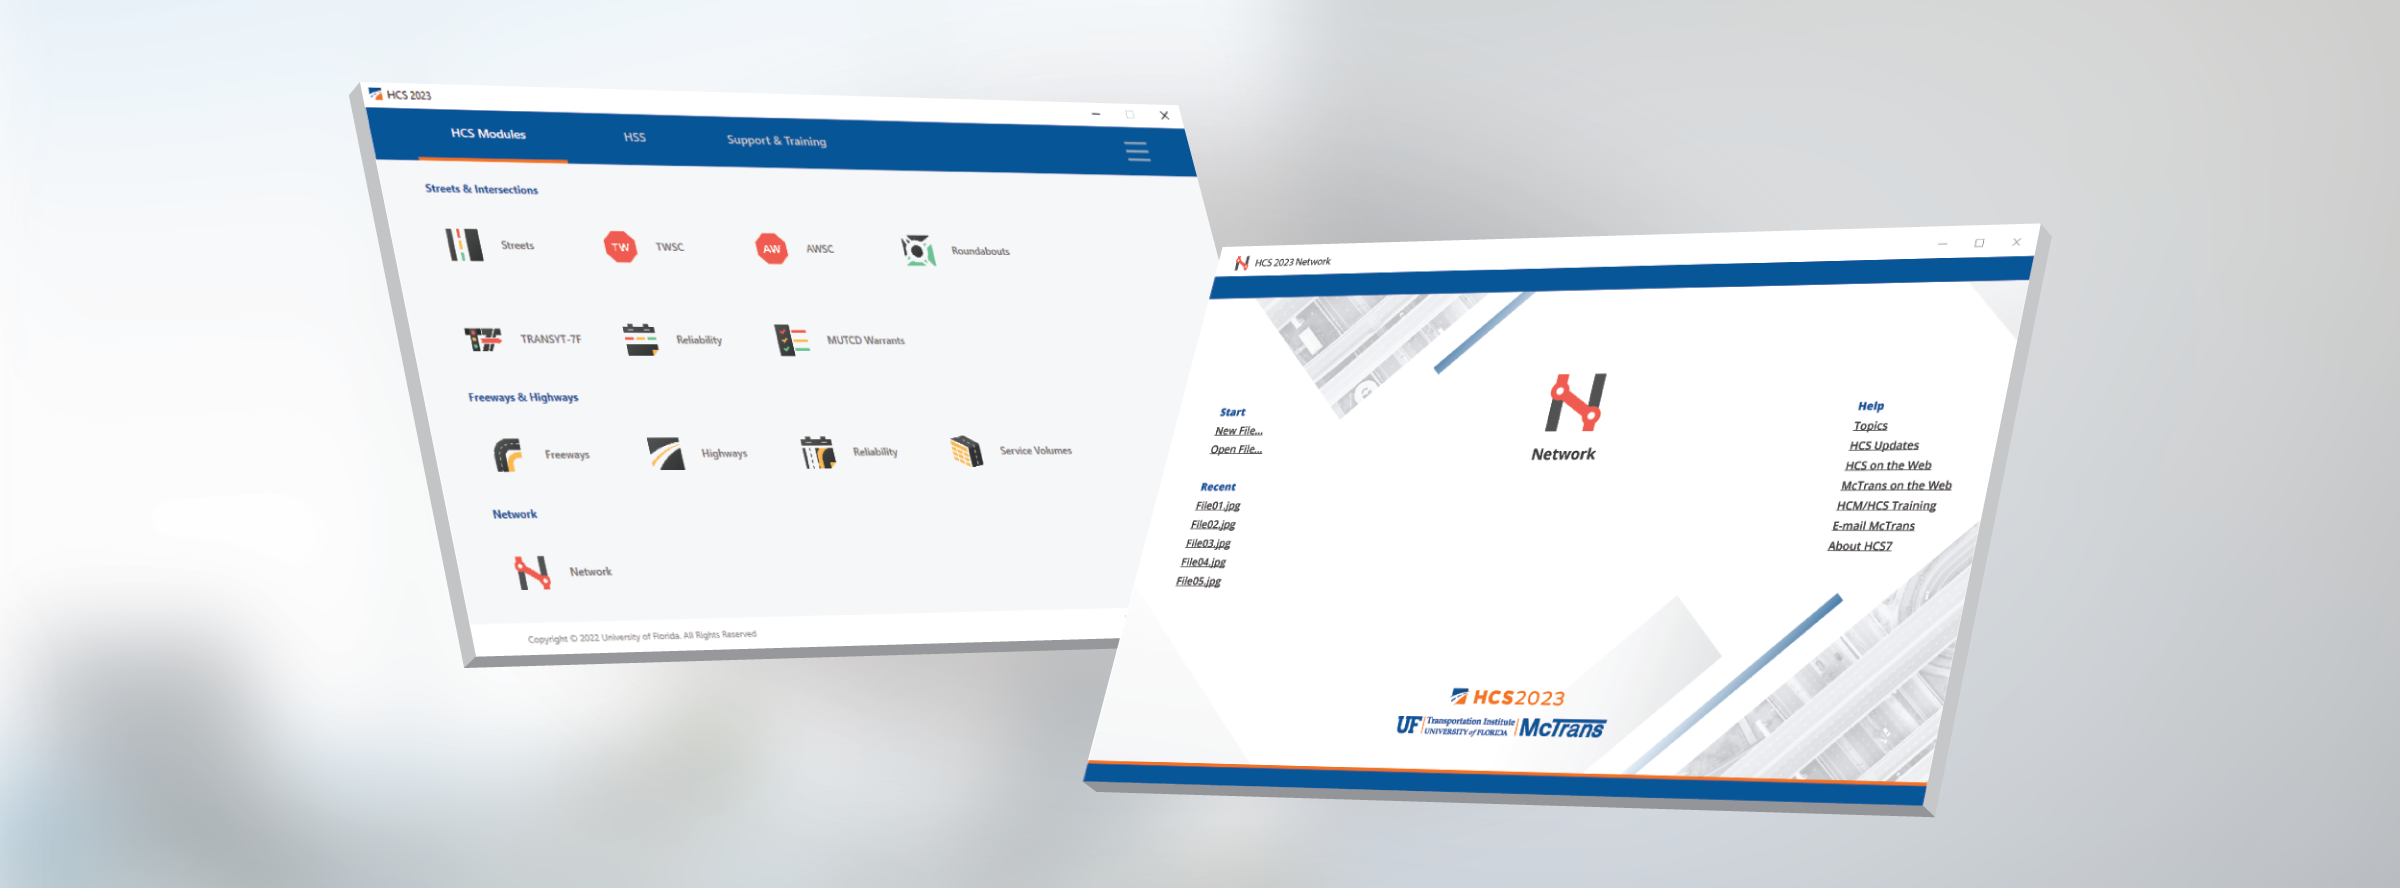
The 2023 release of the Highway Capacity Software (HCS) includes the new module Network Analysis, which will allow users to evaluate corridors comprised of freeways and arterials for the first time. The underlying methodology is published in Chapter 38 – Network Analysis of the Highway Capacity Manual 7th Edition (2022).
Connecting freeways and arterials
The Network module uses a freeway facility as the base of analysis. From this starting point, the user can model which external facilities connect to the subject freeway ramps – the current release supports signalized ramp terminals and freeway-to-freeway connections.
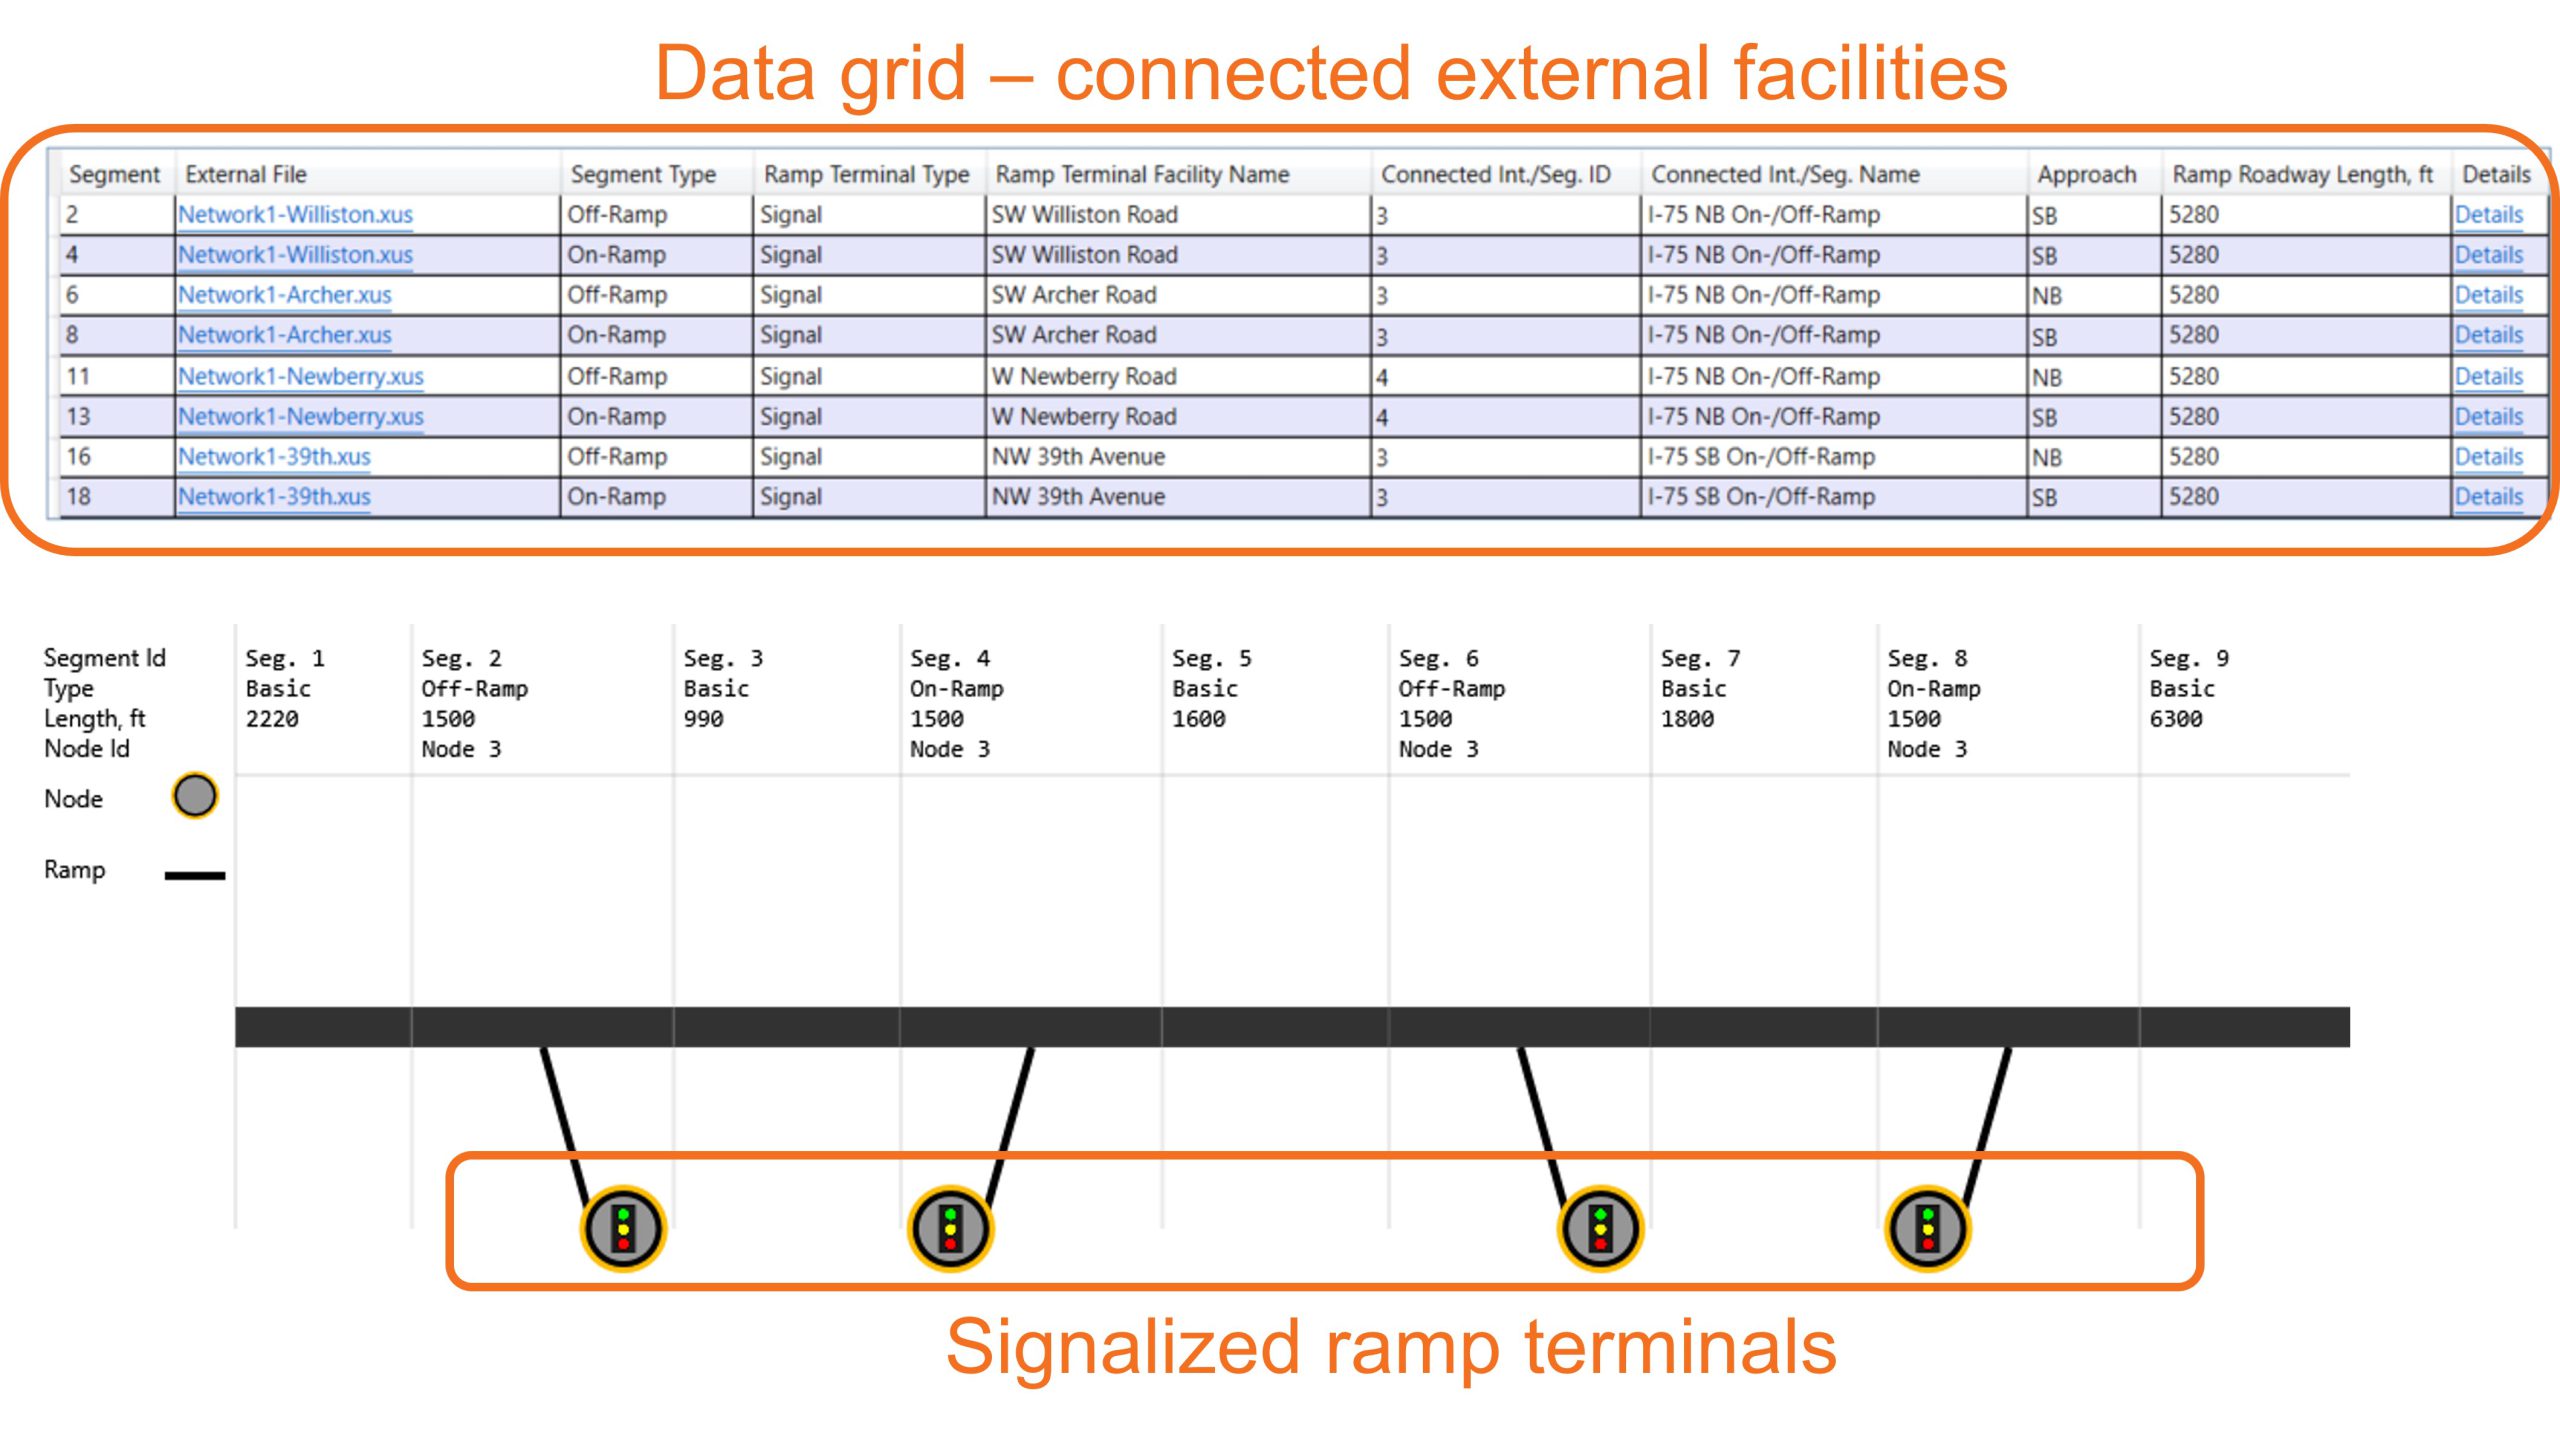
New user interface illustrating ramp terminals connected to a freeway
O-D analyses and travel time as a common performance measure
Travel Time is reported as the standard performance measure to evaluate systems with freeways and urban streets. For a given network, HCS provides a detailed estimation of travel times for any pair of nodes that form a feasible travel route:
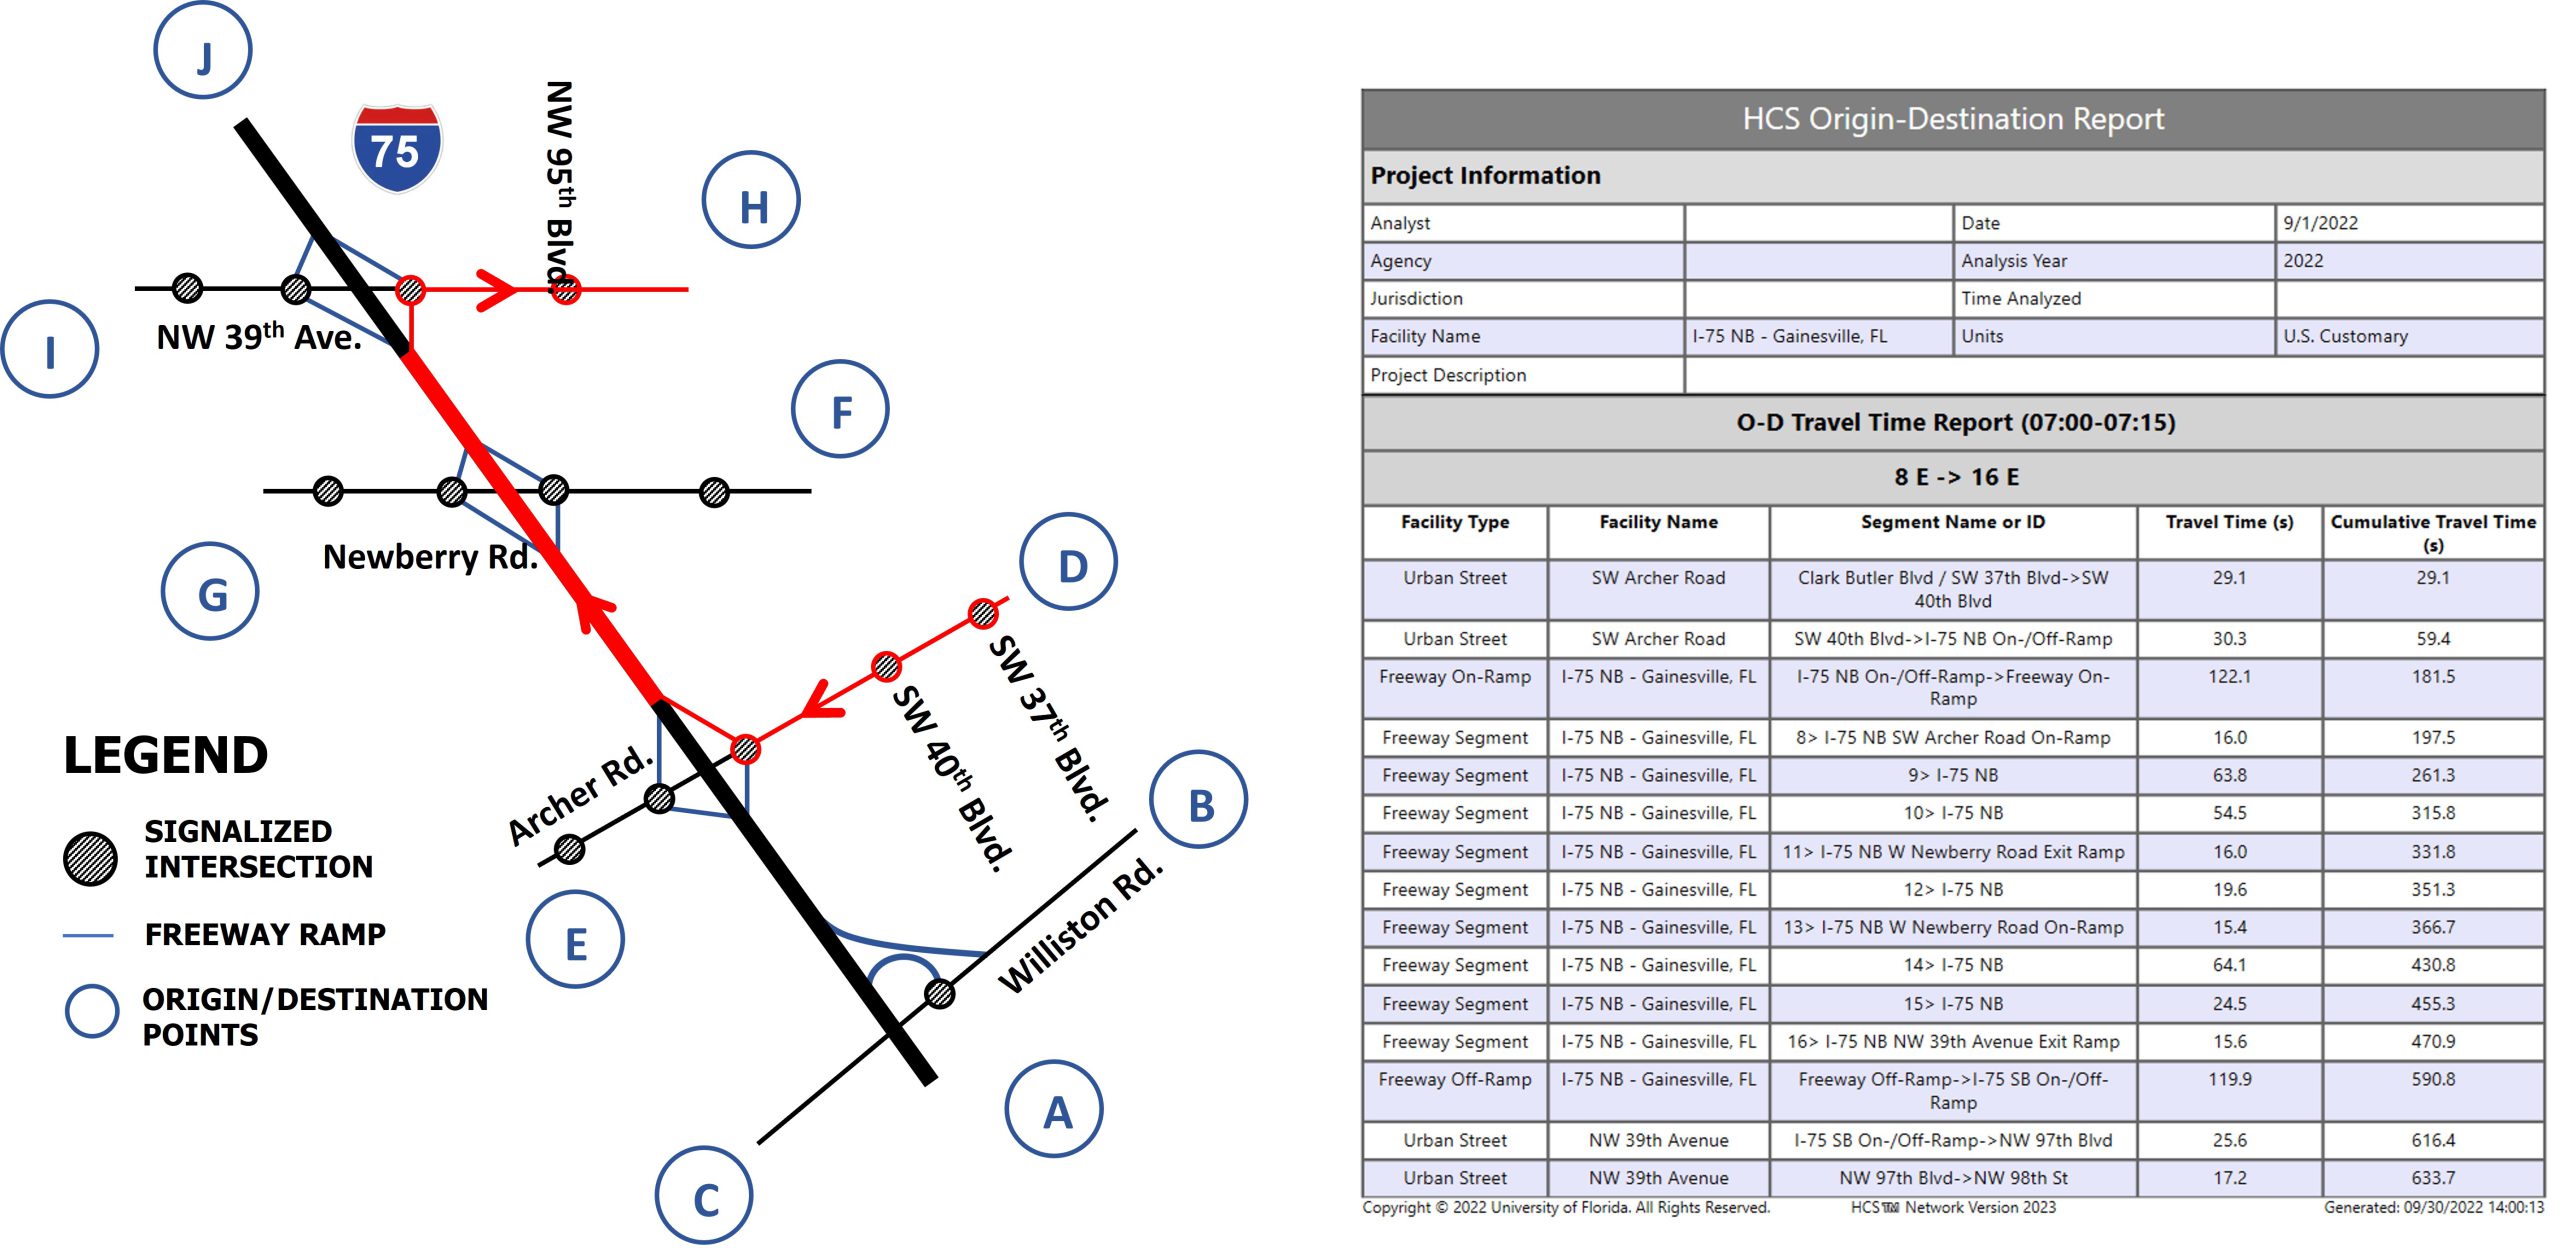
Sample report for a O-D route between two nodes (D and H)
Freeway speeds and travel times can vary widely depending on the lane used, and each OD pair is likely to use a specific set of lanes over each segment. HCS can now evaluate the performance of freeways segments on a lane-by-lane basis as a function of factors such as demand-to-capacity ratio, presence of nearby ramps, heavy vehicle percent, and grade.
The figure below illustrates an application of the O-D-oriented travel time analysis. Although routes A-A and B-B traverse the same set of segments, they are expected to use different lanes and therefore yield different travel times.
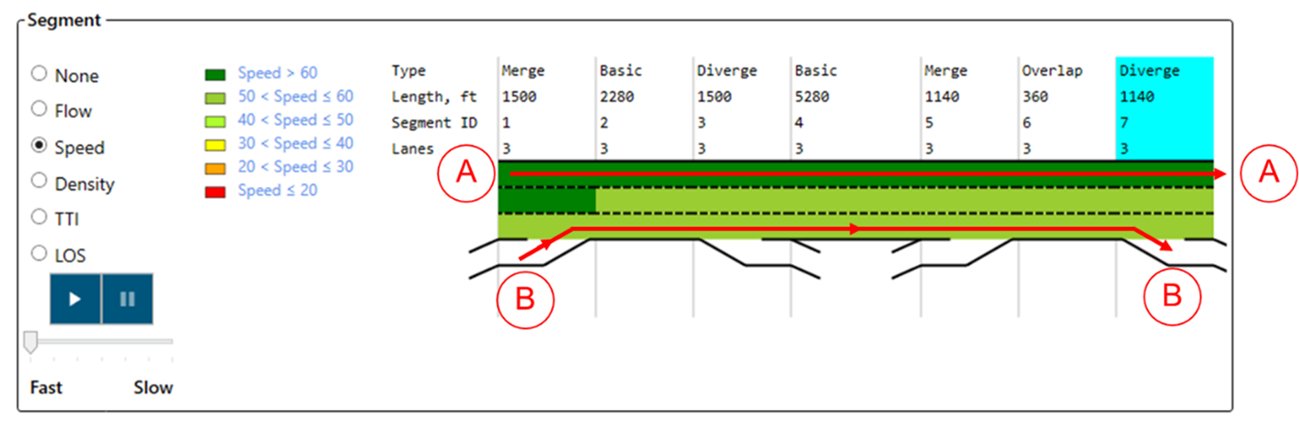
Which route would yield the shortest travel times? A-A or B-B?
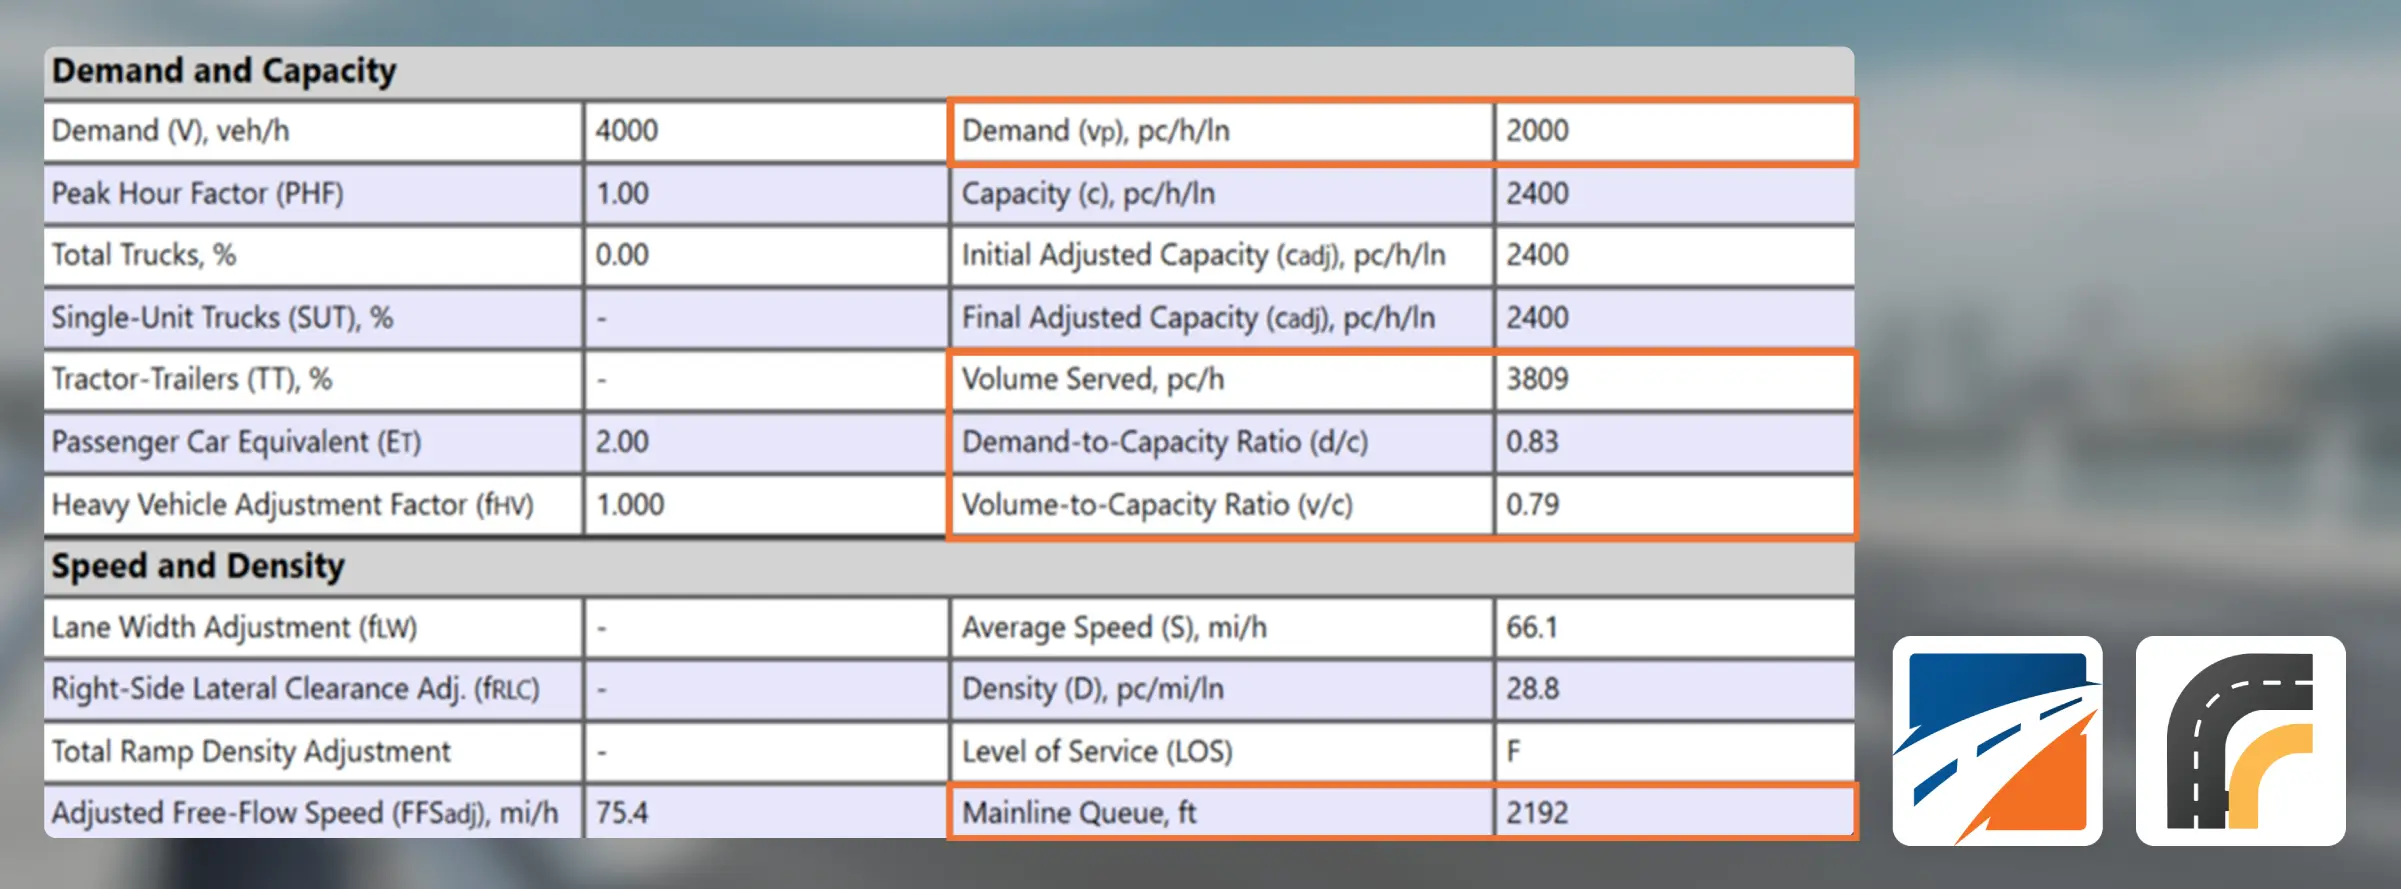
Queue spillback checks
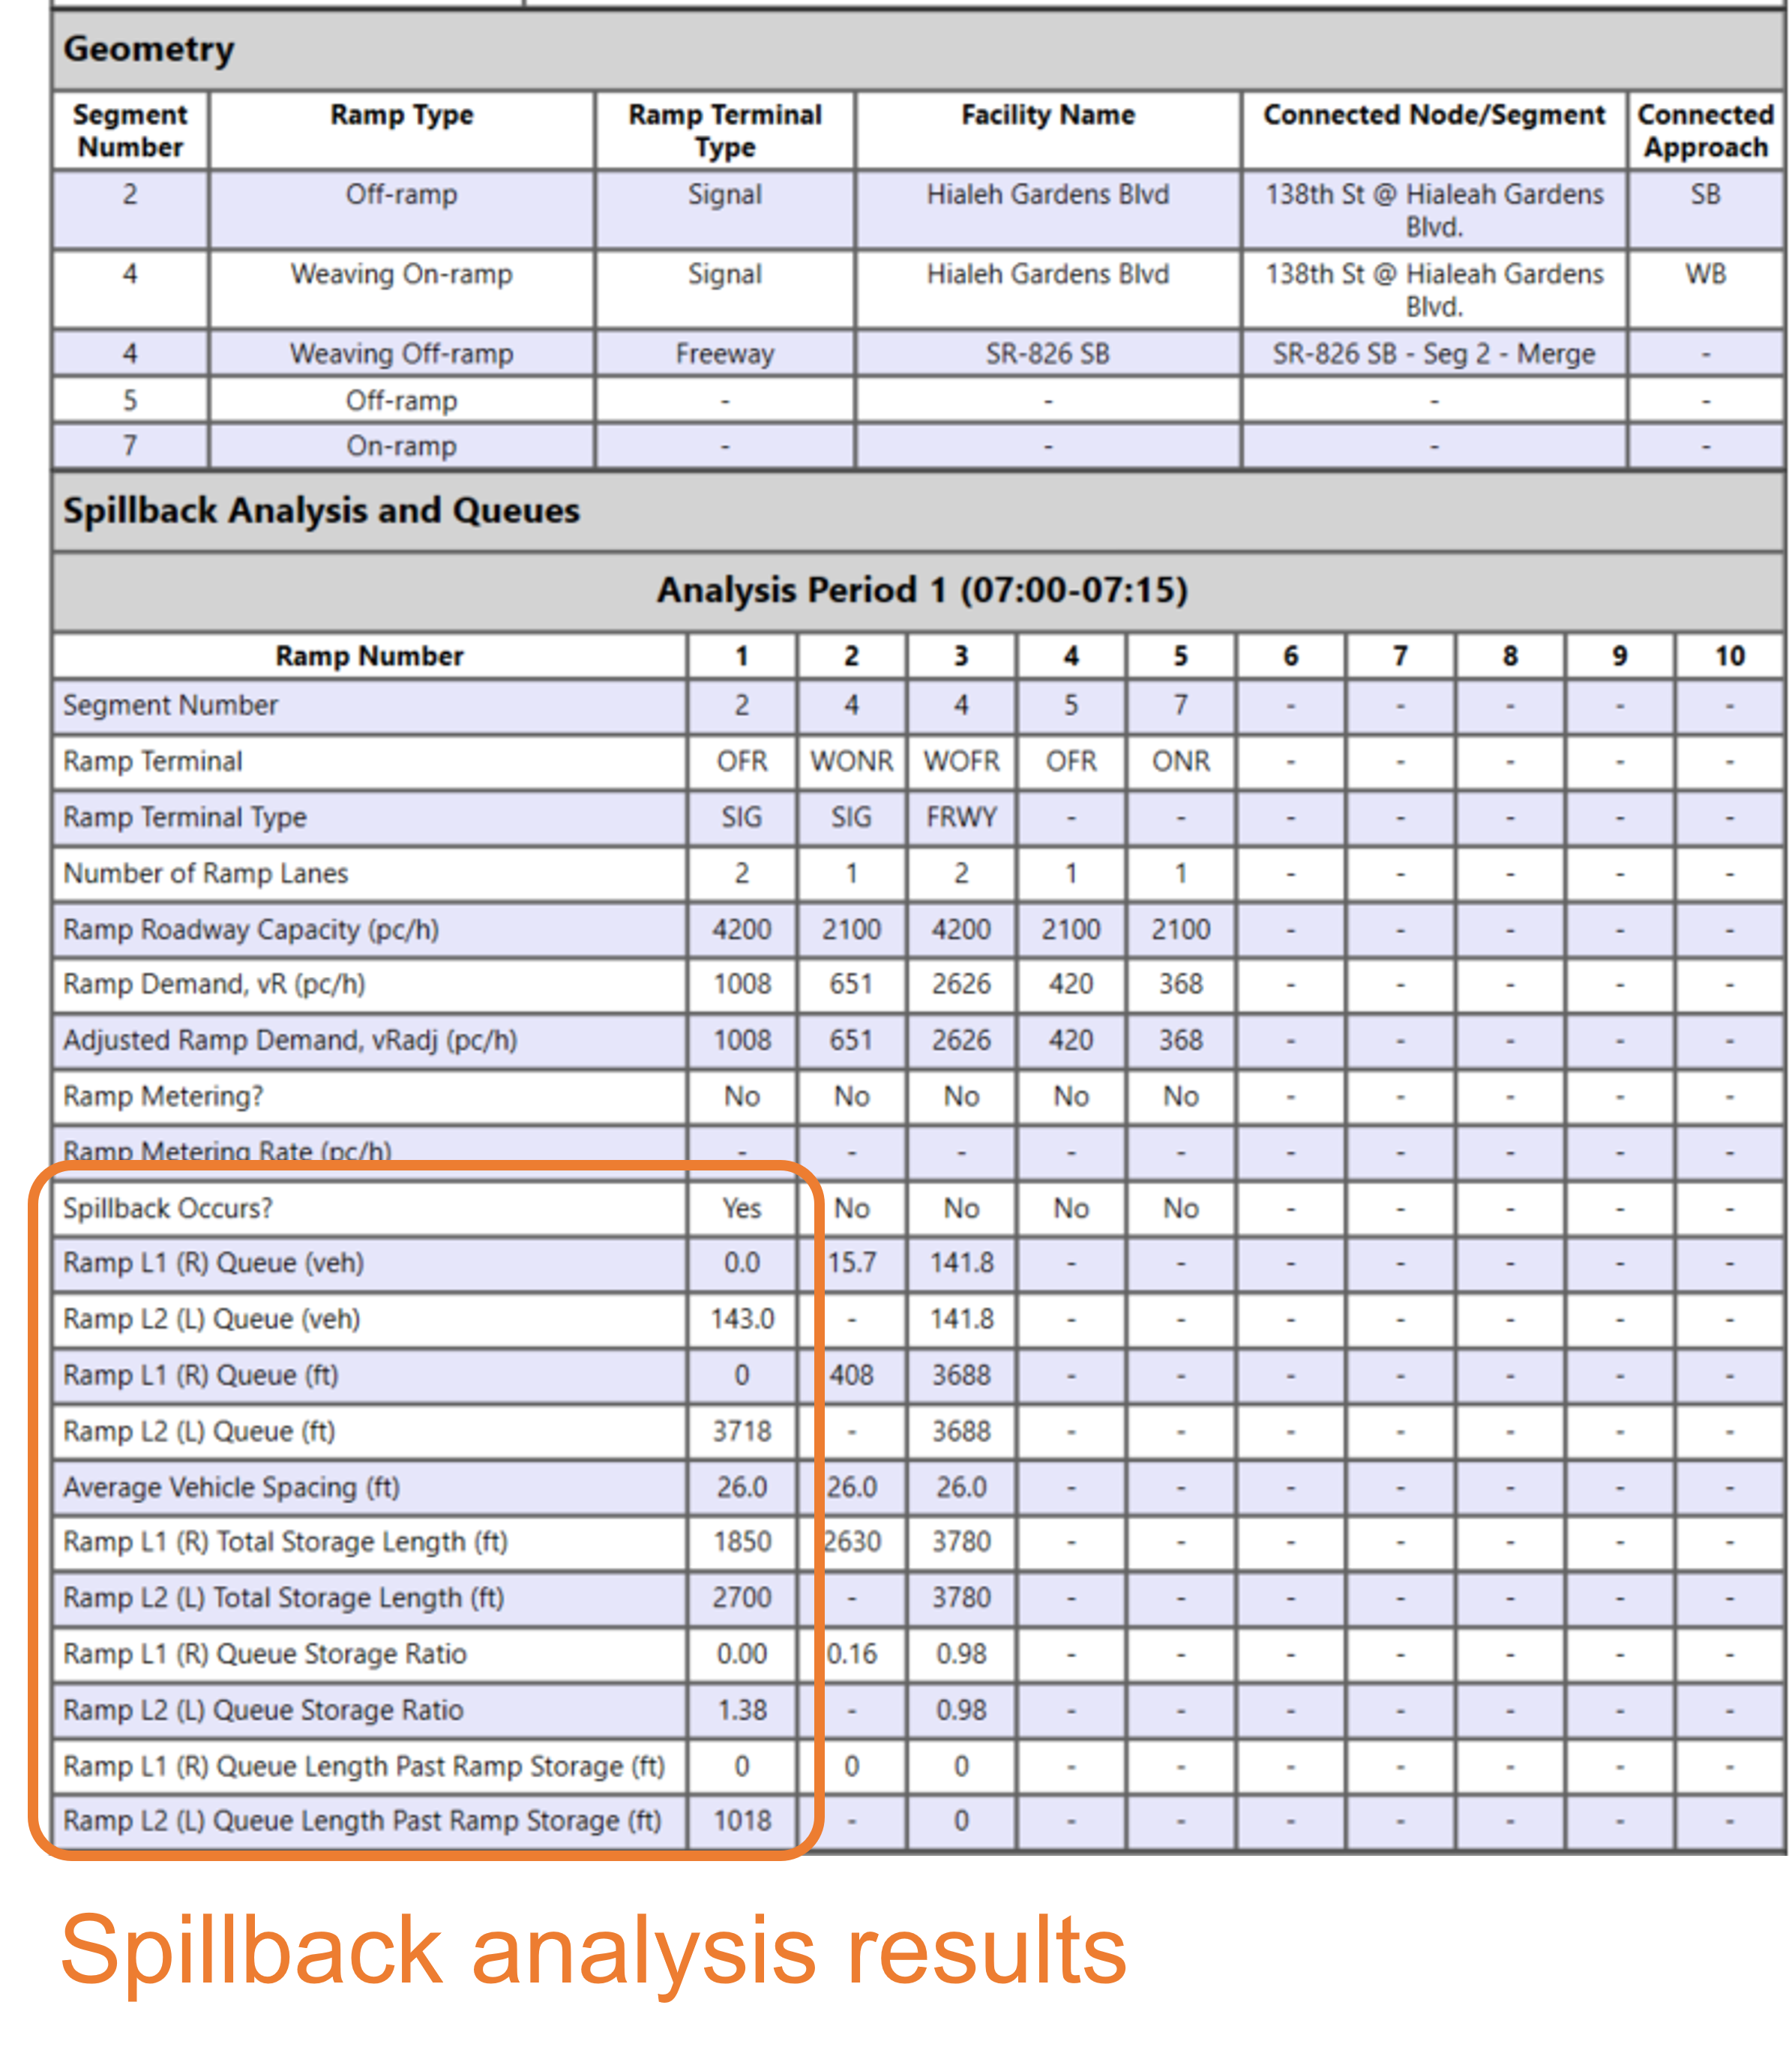
Queue spillback at freeway ramps occurs when one road or traffic control element has insufficient capacity, and the queue extends beyond the available storage in the ramp roadway, disrupting the upstream traffic flow.
HCS can now check for the occurrence of queue spillback through both off-ramps and on-ramps by integrating the analyses of intersections and freeways. Resulting queues from a congested ramp terminal, arterial traffic control, or a downstream congested freeway (for freeway-to-freeway connections) serve as inputs to calculate whether queues will exceed the available storage length and cause spillback.
Different methods are available to estimate the impact occurrence of queue spillback on signalized intersections, stop-controlled intersections, or roundabouts. Ramp metering can also be an input to the method at on-ramps as it is a frequent source of on-ramp congestion.