The past couple of Highway Capacity Manual (HCM) releases offer the multi-period analysis and the peak period analysis for both freeways and urban streets. It is essential to understand where these analysis types should be used.
The peak period analysis measures the worst operational condition of the facilities. Typically, Peak Hour Factor (PHF) is used to estimate the peak 15-minute demands within an hour-long demand volume. The operational condition can range from free-flow (LOS A) to close to capacity (LOS E). But what if the peak period analysis report LOS F? How can we interpret the operational condition of the facility?
When demand exceeds capacity (LOS F), the unserved demand will form queues that can last several 15 minutes analysis periods before they get cleared. However, the peak period analysis cannot measure how bad the LOS F condition will be because it does not account for the effects of queue formation and dissipations over the facility in subsequent analysis periods. As such, the “peak period” analysis should NOT be used for oversaturated conditions.
On the other hand, the multi-time period analysis focuses on several analysis periods, each being a single study period. The demand volumes are provided for all 15-minute analysis periods. Thus PHF is not needed for this approach.

The major differences between the two approaches are summarized in the following table:
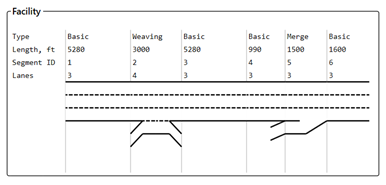
To better understand the difference between the two approaches when the operational conditions during the peak period are oversaturated, let’s look at this example. The following speed heatmap shows the average speed (mph) of a freeway segment during the peak period. As seen, the red color code corresponds to the existence of queues:

As discussed, the peak period cannot determine how bad the condition is in the following peak periods. The same analysis is replicated for a longer study period. The below table shows the speed heatmap for the same facility. In fact, the period after the peak period will operate at the worst condition due to a large number of unserved vehicles. Other than failure in determining the worst operational condition, the peak period analysis cannot provide a complete picture of user delay costs for the peak period.

A similar condition can occur in the Urban Street analysis. As such, the multi-period analysis can account for the impact of queues while forming and dissipating, providing a comprehensive view toward facilities operational conditions.
When a facility is under capacity, both peak period and multi-period analysis will report the same results! However, when traffic condition is oversaturated, peak period analysis will generate a misleading result. It is always advised to evaluate the operational condition of the analysis to determine if there are queues or not, then, based on that, pick the correct type of analysis. Of course, a multi-period analysis can always be used, regardless of traffic condition, to estimate performance measures.
In summary, the recommended analysis approach is:
- For undersaturated conditions (LOS E or better), peak period analyses provide a reasonable estimation of performance with a small amount of required effort
- For oversaturated conditions (LOS F), multi-period analyses must be used to account for the effects of queueing in freeways
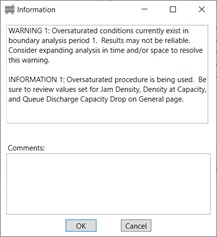
The HCS will prompt a warning message when the analysis condition requires a multi-time period analysis. The following image shows an example warning message where the oversaturated condition exists in a single analysis period (peak period analysis).
The HCS will prompt a warning message when the analysis condition requires a multi-time period analysis. The following image shows an example warning message where the oversaturated condition exists in a single analysis period (peak period analysis).


