
Dr. Fabio Sasahara
For several decades, the Highway Capacity Manual has been applying the concept of Passenger Car Equivalents (PCE) to capture the effects of heavy vehicles in the traffic stream. These models assume heavy vehicles have different powertrain and acceleration characteristics, and therefore one heavy vehicle would have a greater impact on traffic when compared to a passenger car.
However, the PCE factors may not be accurate when at least one of these conditions exists:
- Significant presence of trucks in the traffic stream
- A long upgrade
- A combination of both factors above
The HCM mentions the Mixed-Flow Model to address this issue in freeway basic segments and multilane highways. While the PCE approach assumes vehicle speeds are uniform across all vehicle types, the Mixed-Flow model calculates speeds for passenger cars and trucks individually, yielding more accurate results.
The required inputs for the Mixed-Flow Model include:
- Total percentage of trucks and the proportional distribution of Single-Unit Trucks (FHWA classifications 4-5) and Tractor-Trailer Trucks (FHWA classifications 6-13)
- Grade percentage (%) and length (mi)
For low percentages of trucks and mild upgrades, the results provided by the PCE methodology are comparable to the ones provided by the mixed-flow model. The HCM, however, does not provide a strict definition of what values of %HV and grade are considered significant to support a mixed-flow analysis.
Therefore, the main question remains:
Under what conditions should we consider using the mixed-flow model?
To illustrate the differences between PCE and Mixed-Flow outputs, a sample basic segment with the following characteristics is analyzed:
- Demand: 4,000 veh/h
- Free-Flow Speed: 65 mi/h
- 8% grade, with a 1-mile length
- Truck mix: 30% SUT, 70% TT

Since this segment has a significant grade of 8%, differences can be noticed even at 1% heavy vehicles, as the mixed-flow model yields a 16% lower speed and a 6% higher density. As the percentage of heavy vehicles increases, the differences between the two methods also increase.
The Mixed-Flow model approach can be activated in HCS by checking the following box (make sure the terrain type input is set as “Specific Grade”):

Both results are provided in the HCS report so the user can compare both outputs and assess whether the differences are relevant:
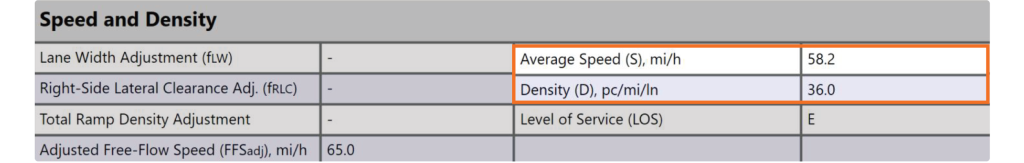
(a) PCE – performance measures
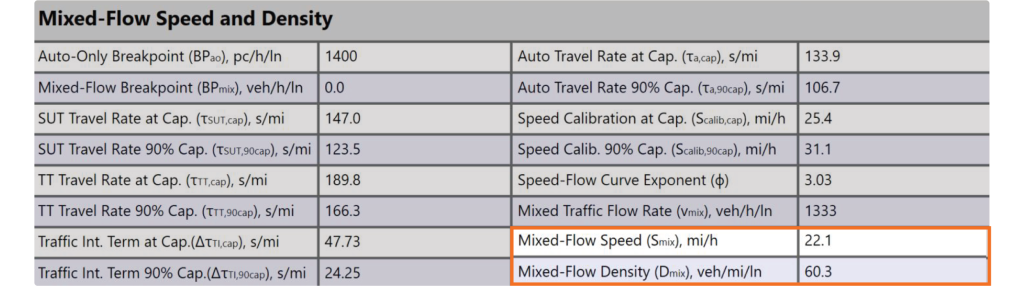
(b) Mixed-Flow – performance measures
Engineering judgment is required to determine the acceptable difference on a case-by-case basis. Nevertheless, the Mixed-Flow model approach is not data intensive and can be easily performed in HCS. Therefore, a recommended practice is to always include this approach in your analysis if either grades or the presence of trucks are significant.